(In Progress Not Finished) Fixed Strike Volatility, Floating Strike Volatility, Spot Vol Dynamics And The Skew Stickiness Ratio Part 1
07 Jun 2026Intro
Today I want to talk about some topics in the volatility space that confused me for a long time but are extremely important to understanding volatility modeling and volatility trading nomenclature. The terms fixed strike, floating strike, sticky strike and sticky delta (or alternative version) come up a lot all over the place and are sometimes thrown around loosley. On top of that if we throw fixed strike skew and floating strike skew which we can also replace skew with spot vol beta cov, corr, etc… You can see how these terms can get confusing. I still top this day will see a pretty chart or formula saying fixed strike skew term structure and have to stop and stare at it for a second. I’ve seen many well established successful people in the vol space mix them up and confuse one with the other and that is part of the reason why they can be tricky to get a grasp of, so what I want to do in this post is talk about how I like to think of them and give some examples of there usage in the world of volatility.
Definitions
I am going to start off by simply defining these terms and maybe giving you a few pictures to hammer home the meanings. A great way to think about these which was elequantly defined by Benn Eifert from QVR is “Sticky strike and sticky delta refer to spot vol dynamics and fixed stirke and floating strike vol are specific parameters of the volatility surface”. Not sure if this is an exact quote but close enough. That definition is something you should keep in your head especially as we move forward thoughout this post (and in future posts) and I will often go back to it.
Fixed Strike - Floating Strike Volatility
What does it mean to parameterize a volatility surface, well in mathematical terms we can represent the volatility surface as some function $\sigma(.)$ that has specific parameters that when we plug them in we get an implied volatility. On a fixed strike basis the parameters would be strike K and maturity T $\sigma(K, T)$. In general I like to think about the parameterization of the volatility suraface as how we define the x-axis, for fixed strike we use our strikes and for floating strike it would be something like delta $\sigma(\Delta, T)$ or moneyness $\sigma(k, T)$ ($k = K / F$).
What really helped me understand these topics is reading through Emanuel Dermans volatility class lectures. In the lectures he explores fixed strike and floating strike vol from a time series perspective and I want to show that here. Below I show a time series of multiple fixed strike volatilities, that means at the starting date we choose an option with a specific strike and plot how that same strike option changes everyday, in our example we start at 2026-01-01 and set the strike to be 660 on the lower end and 700 on the higher end when spot is at 680. Every day going forward we plot the same IV for those strike options keeping them fixed.
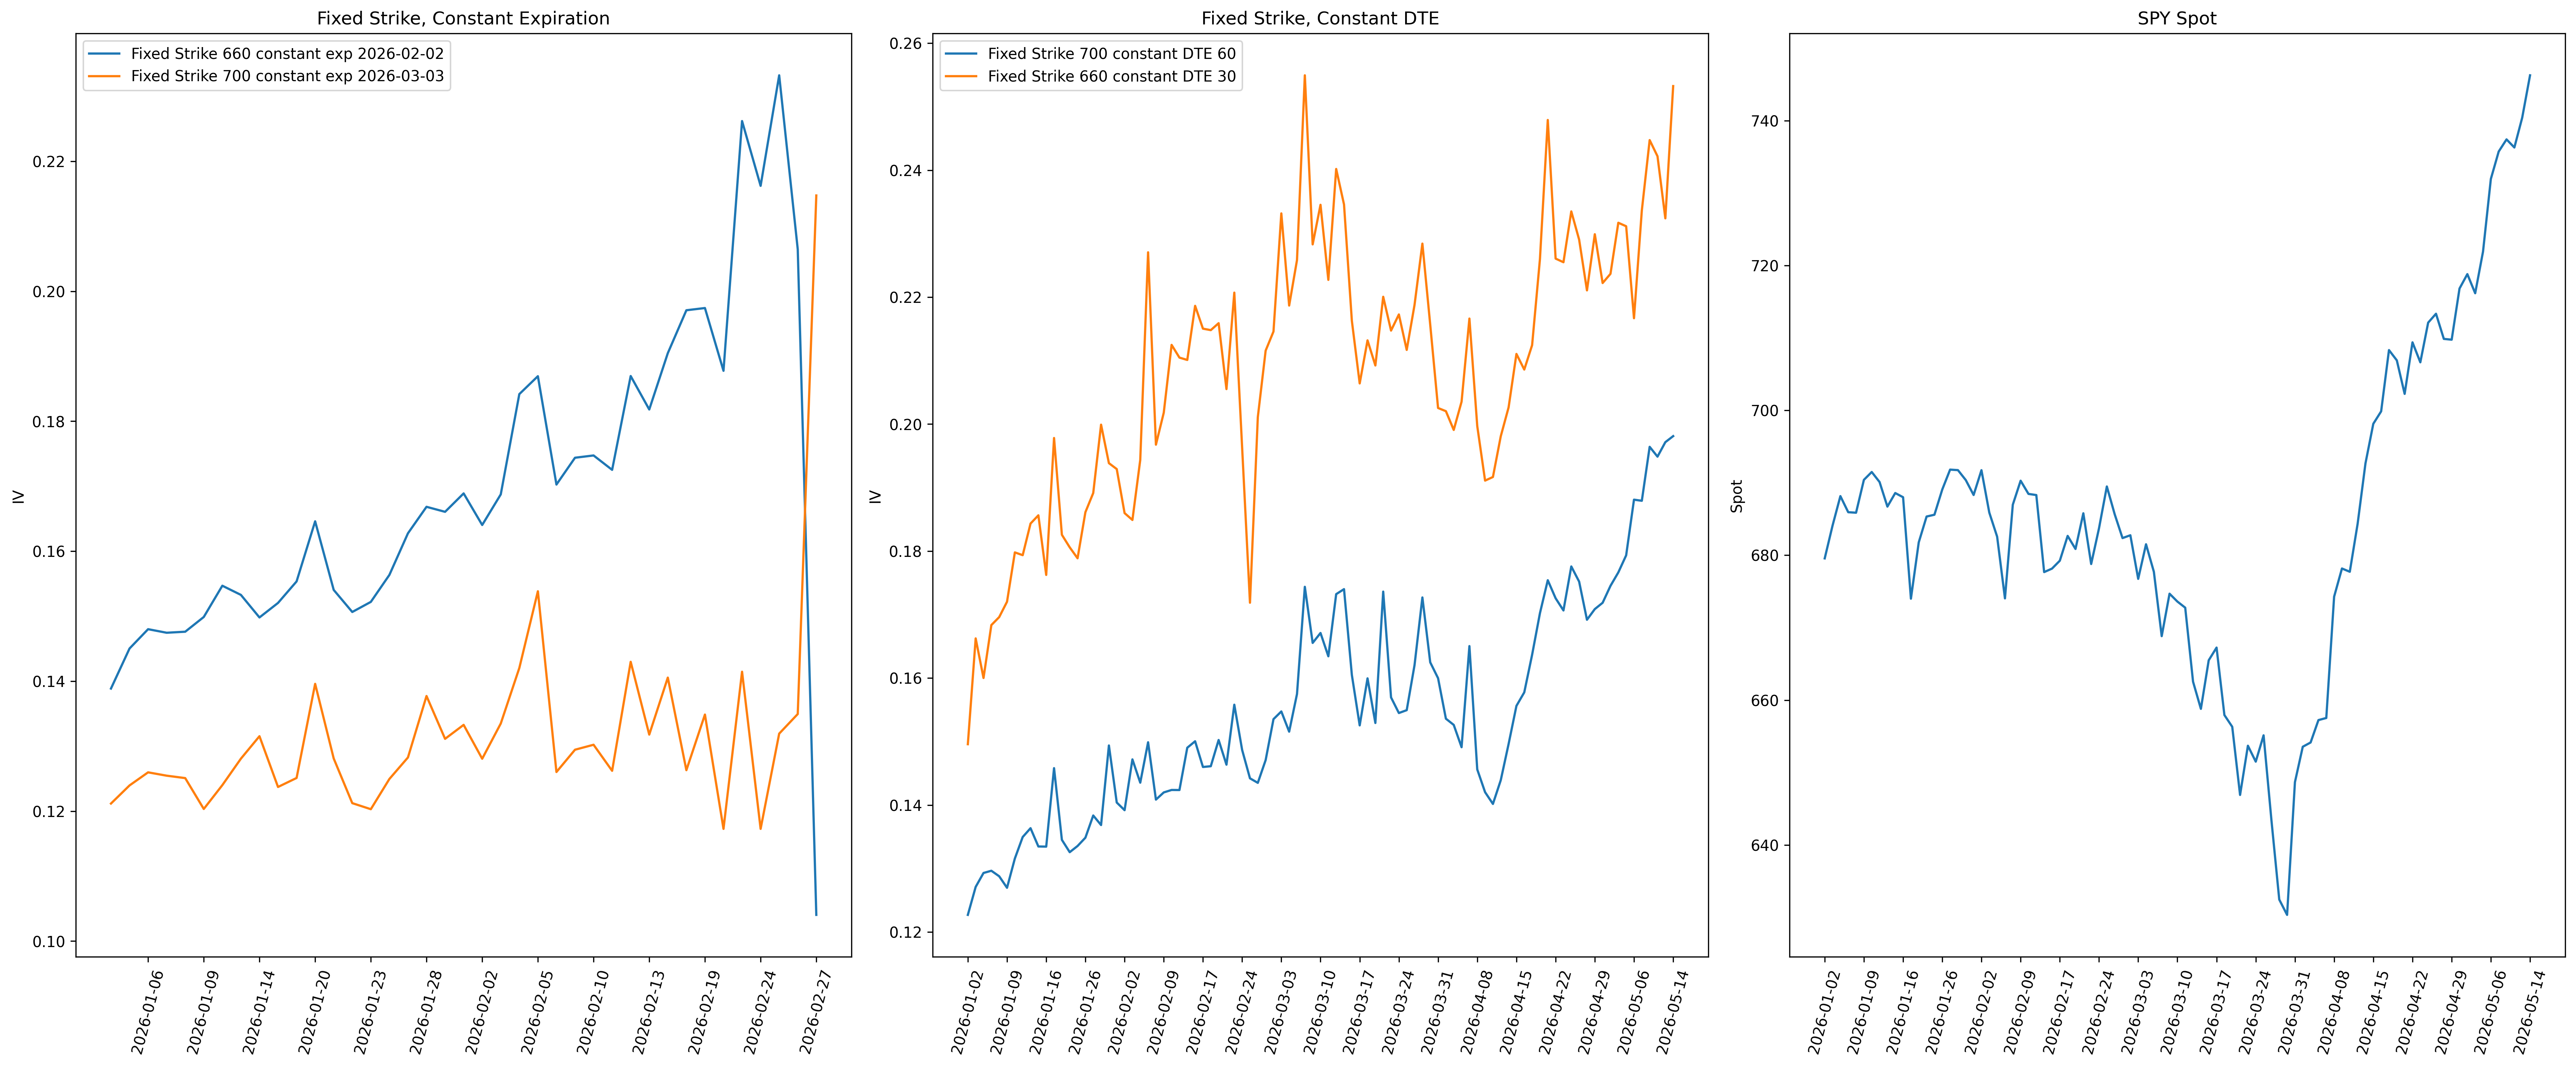
Also it should be noted just like fixed and floating strike we can have a constant maturity (dte) or expiration date and we show that above. A constant expiration is the same expiration date and therefore same option contract throughout the whole time series whereas for constant maturity it is the same days to expiration for the whole series. This is extremely important with respects to backtesting and strategy rebalancing so it is important to be cognizant of that.
Next we show similar graphs for a floating strike volatility time series. Remember because of the specific parameterization of the volatiltiy surface (in this case moneyness or delta) every iv on the time series refers to a different strike
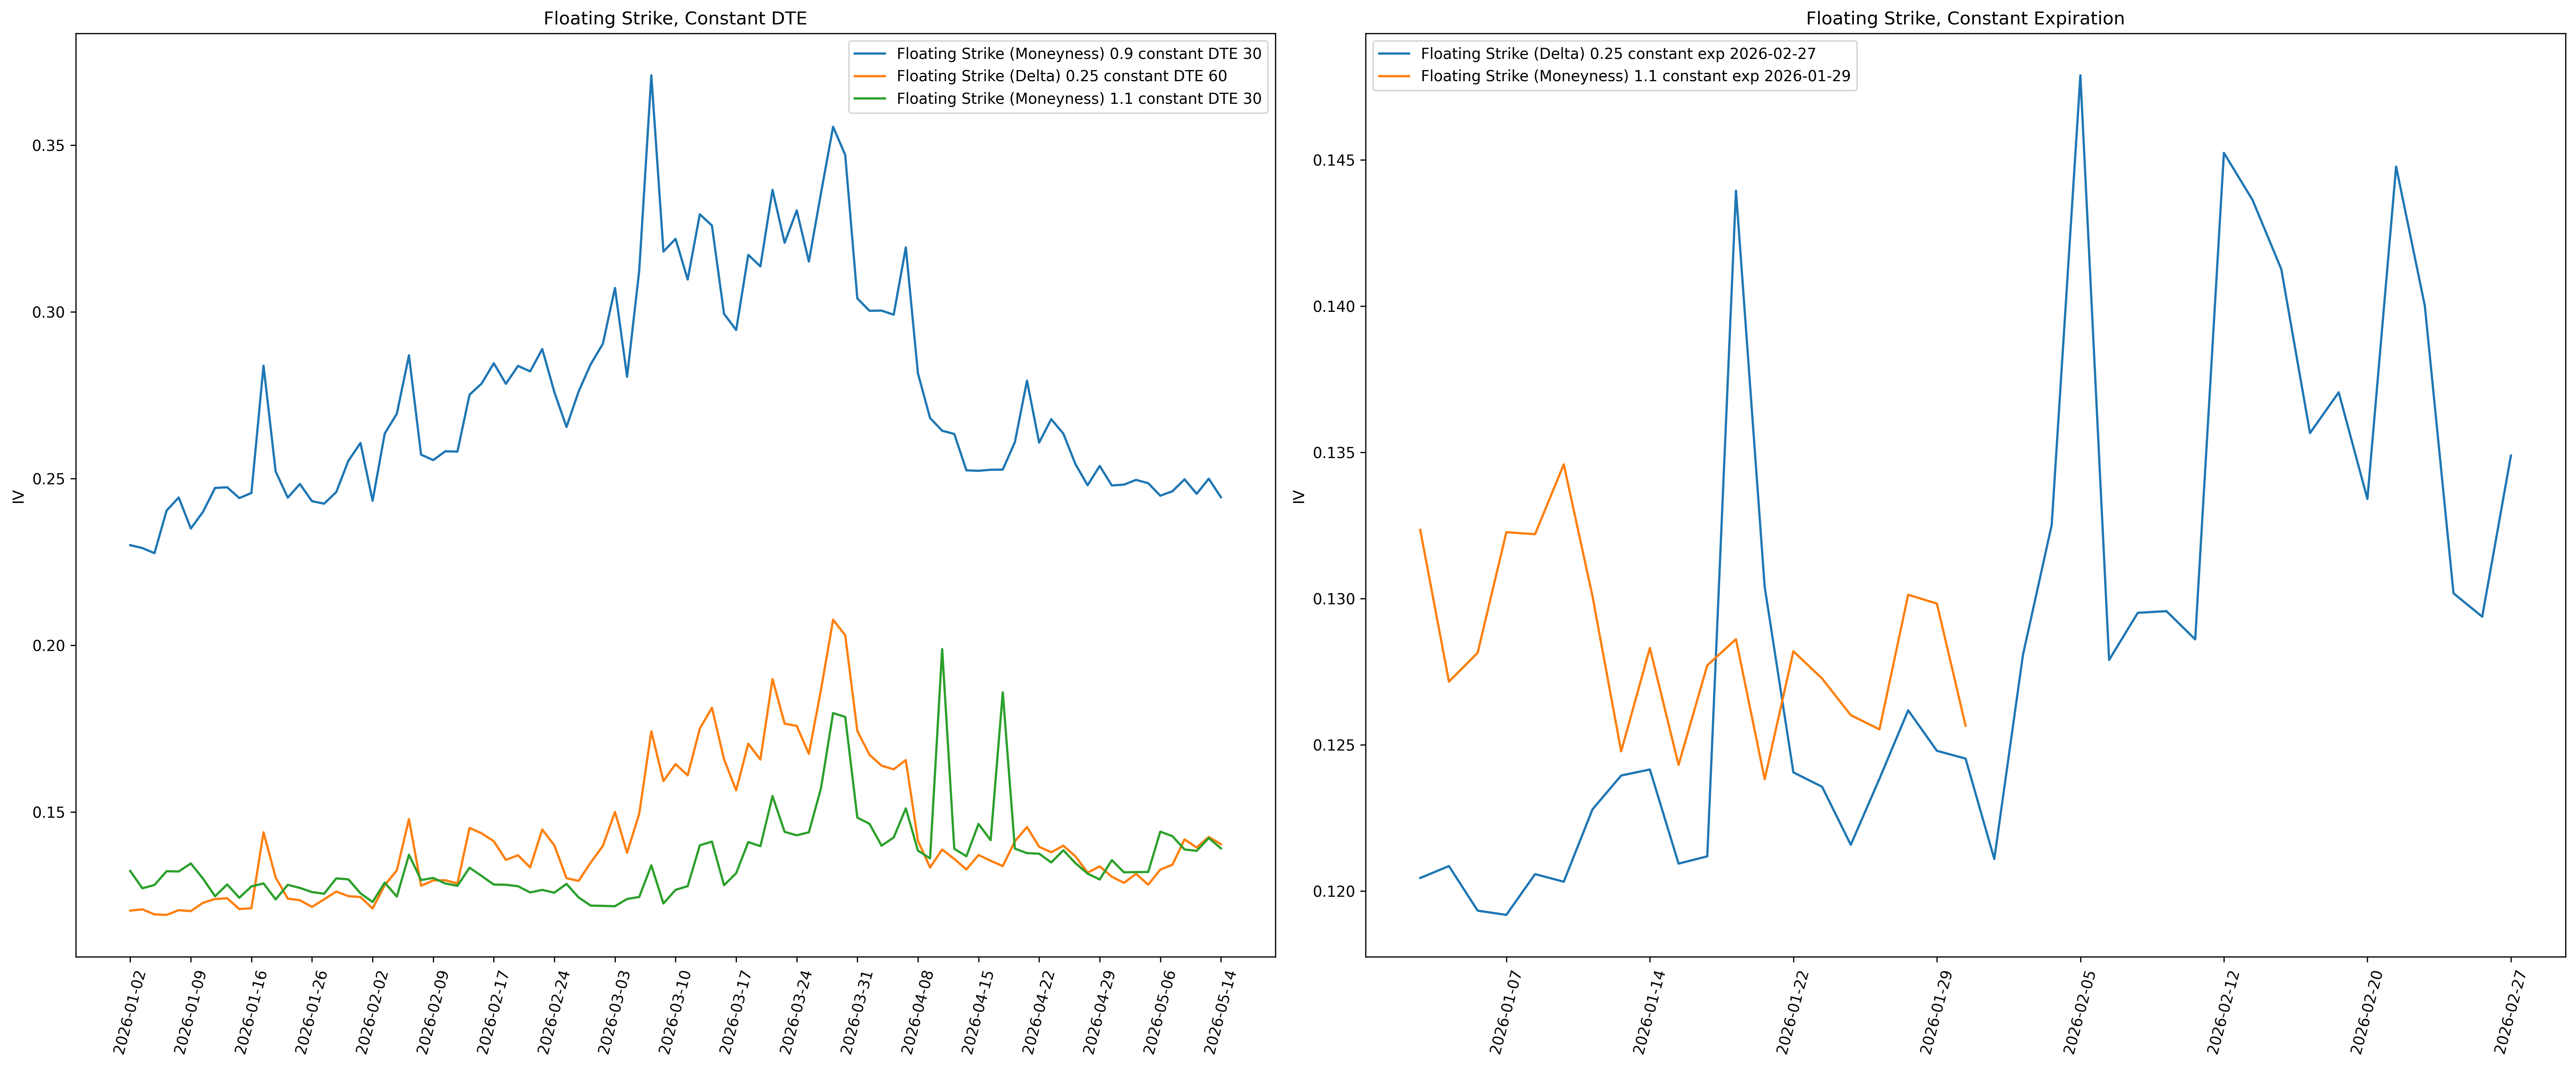
Usually when someone plots a rolling chart of some implied volatility metric it is usually a constant maturity floating strike volatility. For example if you ever see someone post a chart of the ATM IV it is 99% of the time a constant maturity floating stirke ATM IV but nobody ever defined it like that. Another common example is the VIX, this is a constant maturity floating strike volatility metric. the disticntion between fixed and floating strike IV is hardly made but it is important as the below example illustrates.
If you are trying to trade a pure long volatility position by, lets say, buying a straddle and delta hedging it, you usually start buy buying the ATM put and call. The issue is positions and trades are not floating strike, they have to be discretely rehedged to become semi floating strike. If you buy a delta hedged straddle today and dont look at it for a week more likely then not the original spot price will have moved away from ATM and it is no longer ATM anymore. On fixed strike basis how vol chnages is hugely important to our positions P&L, did fixed strike follow the skew curve, did the fixed strike vol meaningfully outperform the skew curve. These are all things options traders look at and need to know and will bring us to our next topic but I briefly want to touch on fixed strike and floating strike skew.
Fixed strike skew and floating strike skew is another topic that confused me for a while and to gain clarification it is important to note that these are not the same as the definitions for fixed strike and floating strike vol I described above. Fixed strike skew can be though of as a volatility independent measure of the skew curve and floating stirke skew can be though of as a volatility dependent measure of the skew curve
Fixed strike skew = 90% moneyness IV - 110% moneyness IV
Floating strike skew = \(\frac{\sigma_{25\Delta\,\mathrm{put}} - \sigma_{25\Delta\,\mathrm{call}}}{\sigma_{50\Delta}}\)
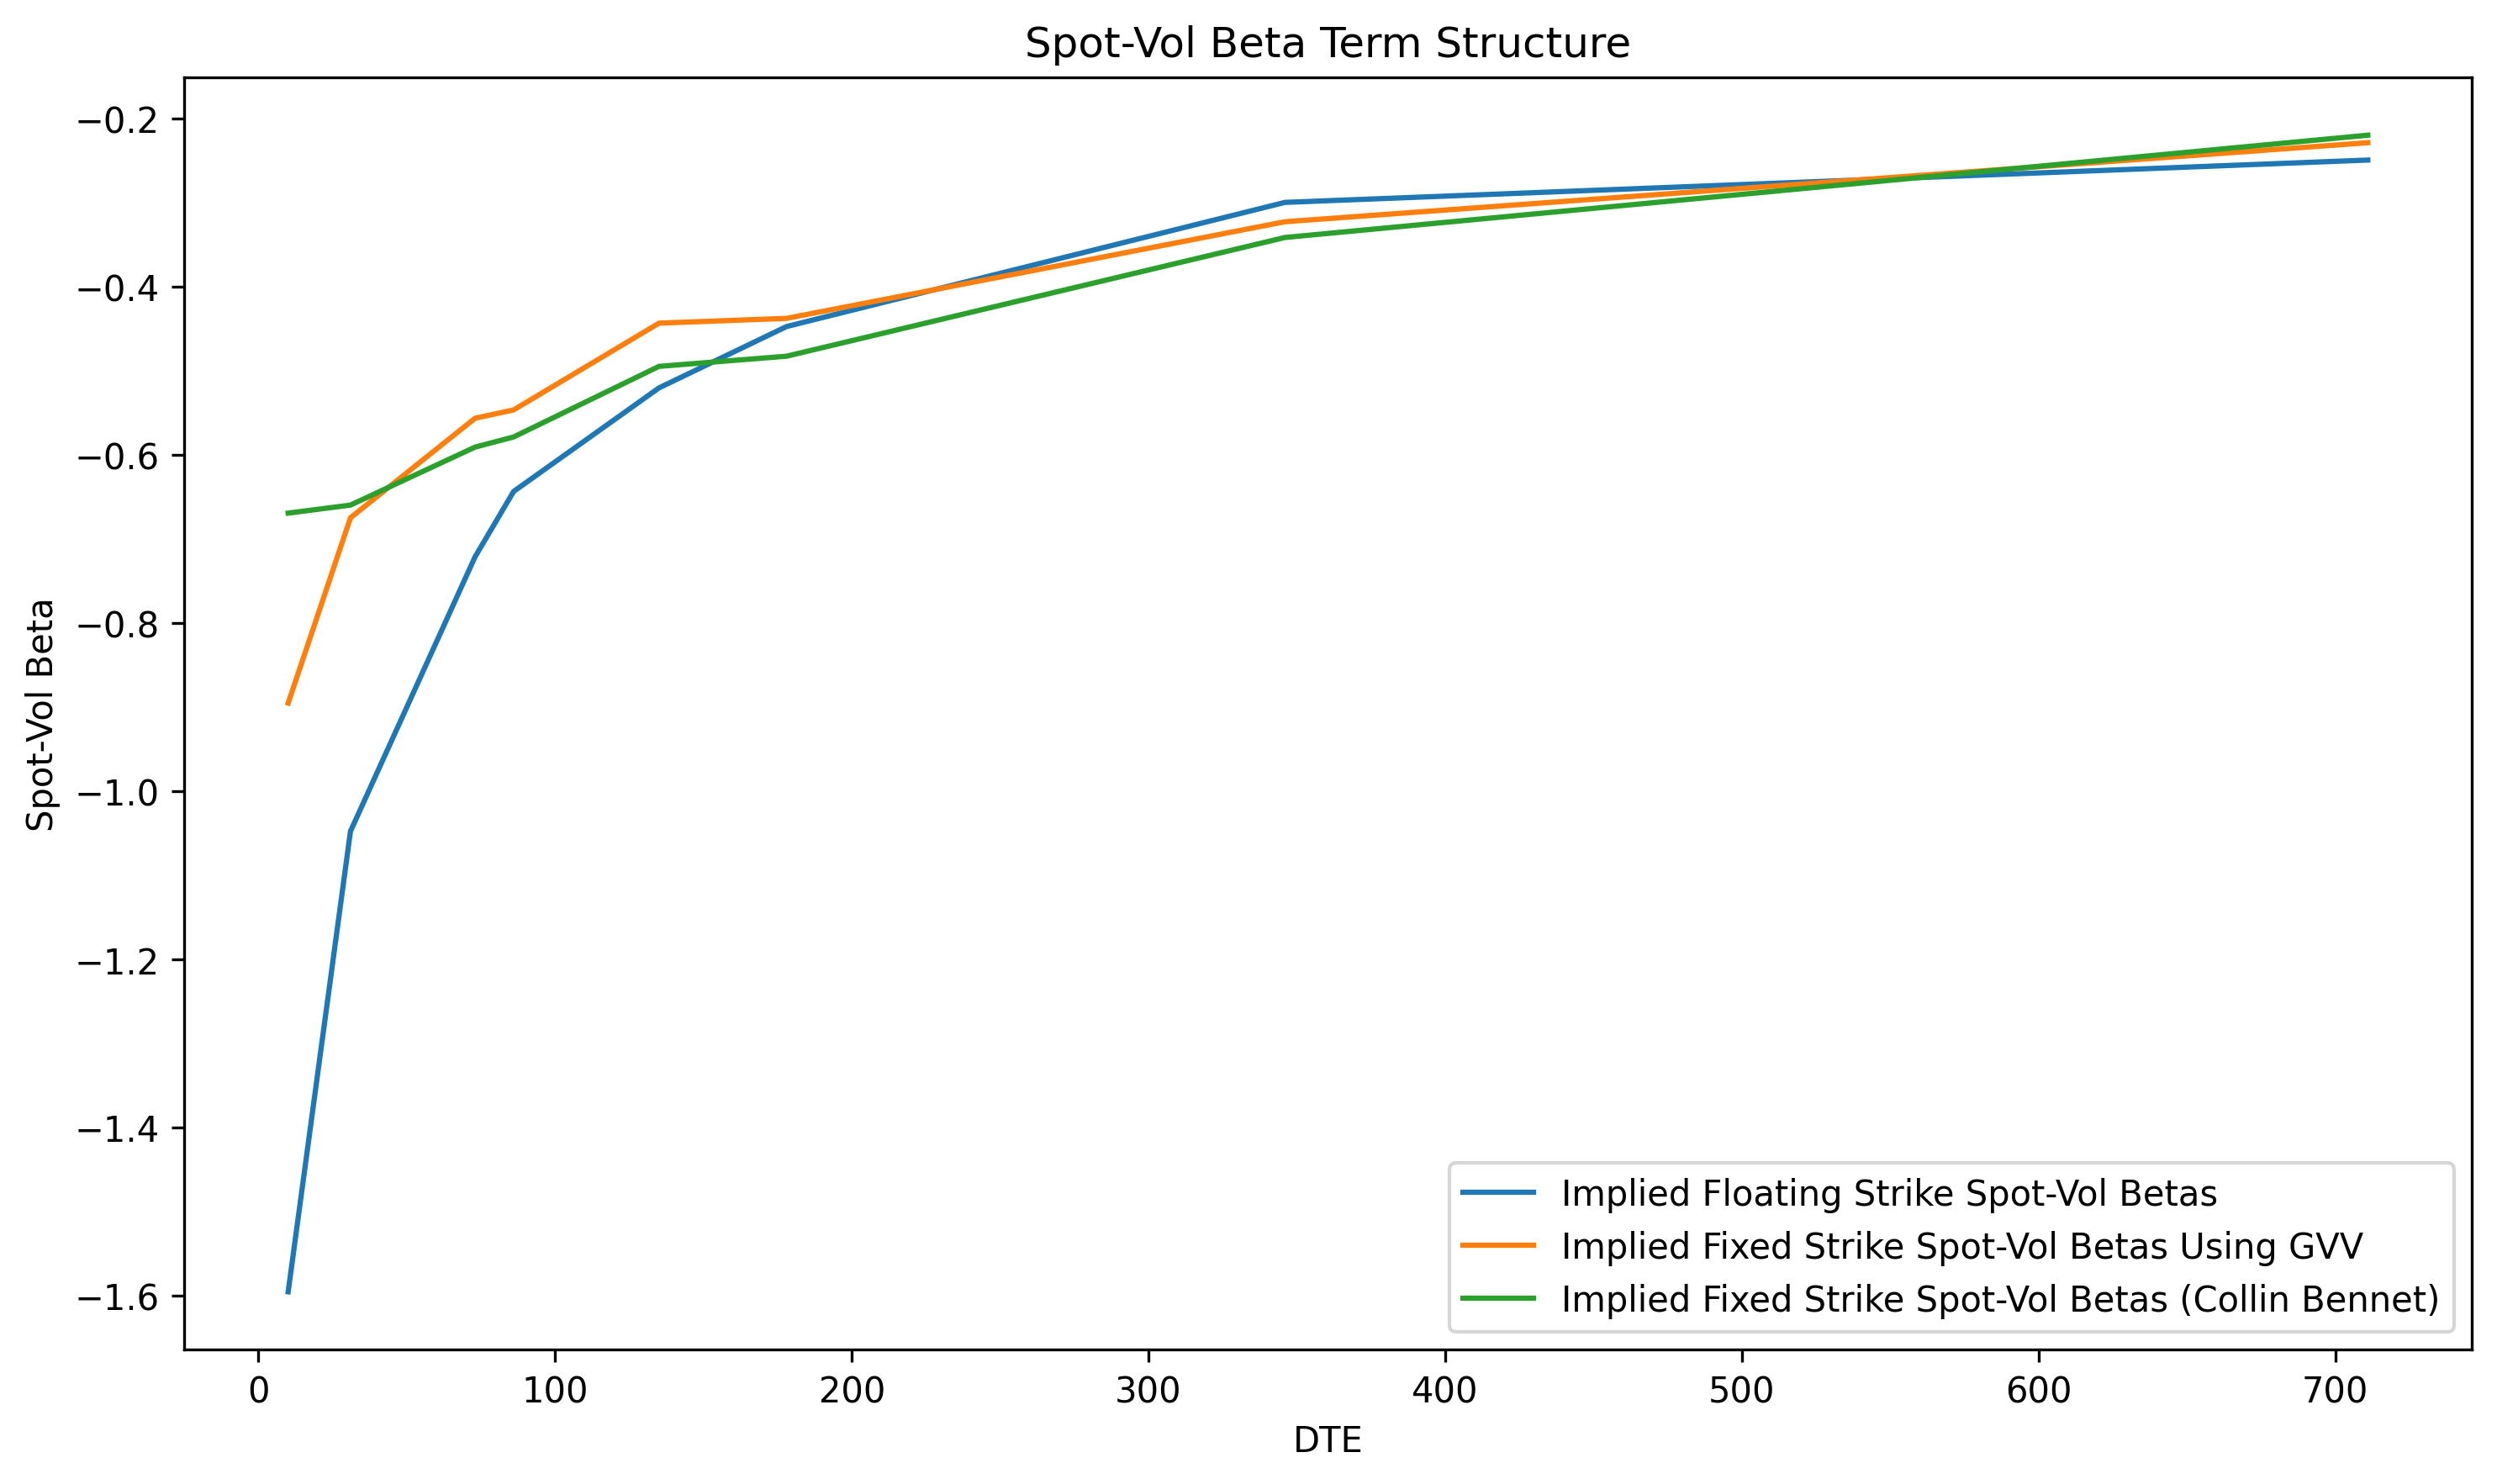
This is best illustrated using a skew term structure at a static point in time. In the below chart the fixed strike skew uses the same strikes for every single maturity whereas the floating strike skew uses the same deltas for every maturity which gives us different corresponding strikes. This will wildly affect our skew estimates for short expirations. Note in the chart I labeled these as spot-vol beta term structures but really they are the same objects just slightly different calculations.
Spot Vol Dynamics
Definition: Mention 3 regimes from collin bennet and SSR briefly As mentioned above spot vol dynamics are wildly important for volatility trading. The profitability of skew trades like a long (short) delta hedged risk reversal directly depend on the dynamics of the volatility surface. Also the delta we choose to hedge with depends on how we expect vol to move as spot moves. The two most common spot vol dynamic “regimes” that are commonly talked about are sticky strike and sticky delta. I want to illustrate below how these regimes will affect a delta hedged long risk reversal, ie long skew. As will see below in both regimes our position will lose money.
Essentially sticky strike says as spot moves the atm iv will just float along the skew curve, if yesterday spot was 100 with atm iv 22 and the 110 strike iv was 20, then tomorrow if spot moves to 110 the atm iv will be 20. (mention first scenario)
add first scenario fig
Sticky delta is different, this assumption says the atm vol (actually whole skew curve) remains constant. In our above example as spot moves from 100 to 110, atm iv stays at 22, essentially the whole skew curve shifts. (mention second scenarios)
add second scenario fig
SSR:
Notes: maybe also mentions spot skew and spot kurtosis dymaics
Risk Reversal 3 Scenarios
In Progress – Stay Tuned