Volatility Surface Risk Premiums: Variance, Skewness, and Vol-of-Vol in S&P 500 Options
24 May 2026Intro
In this post I want to briefly discuss risk premiums related to the volatility surface/options in general. If you disagree or think anything I am saying is not completely correct I would love to hear feedback, also if you just want to connect, my DMs on LinkedIn and X are always open
All of the code and charts used in this post can be found on my GitHub. For the results related to this post, you can check out the Volatility-Surface-Risk-Premiums repository, and for the backend calculations, you can look at py_op.
Now onto the good stuff, we’re going to look at risk premiums related to volatility surfaces. I just want to note that all of the results in this post are derived from 30-day maturity options on the S&P 500.
Premiums
In investing and trading, a risk premium is the compensation investors receive for taking on a specific type of risk. Many risk premiums are well known and have persisted historically. One of my favorite definitions comes from author and volatility expert Euan Sinclair, who describes a risk premium as picking up a $20 bill in the middle of a highway. Most people know the bill is there, but don’t want to take the risk of walking into traffic to pick it up. Those who do take the risk are compensated, as long as they don’t get run over.
In general there are four things that need to occur in order for something to be a risk premium.
-
It needs to persist over time
-
It needs to occur over many asset classes
-
It needs to be scalable in size
-
There needs to be an economic rationale to support it
The most famous risk premium is probably the equity risk premium which is the reward investors get for buying stocks rather than parking their money in a risk-free asset or bank account.
There are numerous risk premiums related to the volatility surface. Broadly speaking, if we can estimate a moment of the risk-neutral distribution implied by option prices and compare it with the corresponding moment of the physical, or realized, distribution, then we can define a potential risk premium around that difference. Practitioners will often estimate a risk premium by constructing a trading strategy and repeatedly trade it over a period of time. In this post, I discuss several option-implied risk premia related to the shape and dynamics of the return distribution, including the variance risk premium, skew/skewness risk premium, and vol-of-vol risk premium
Variance Risk Premium
In the world of options and volatility, this is by far the most well known risk premium. Economically, the variance risk premium can be viewed as compensation earned by investors willing to sell volatility insurance, since short-volatility positions tend to lose money during market crashes when protection is most valuable. Another reason the variance risk premium exists is because institutions generally overpay for downside protection to insure their portfolios and this lifts the price of downside puts. Variance risk premium is typically measured as the difference between implied volatility and realized volatility. For the realized component, we can estimate volatility using the sum of squared log returns. For the implied component, I prefer using the fixed leg of a variance swap with the corresponding maturity, which can be approximated using a strip of OTM puts and calls.
There are, however, some caveats to these estimation methods. For example, realized volatility can be estimated in many different ways, and those statistical approaches are widely discussed, so I will not go into them here. On the implied side, we could also use ATM implied volatility as a simpler proxy for the risk premium, although the variance swap estimate is generally a more complete measure because it incorporates information from across the volatility surface.
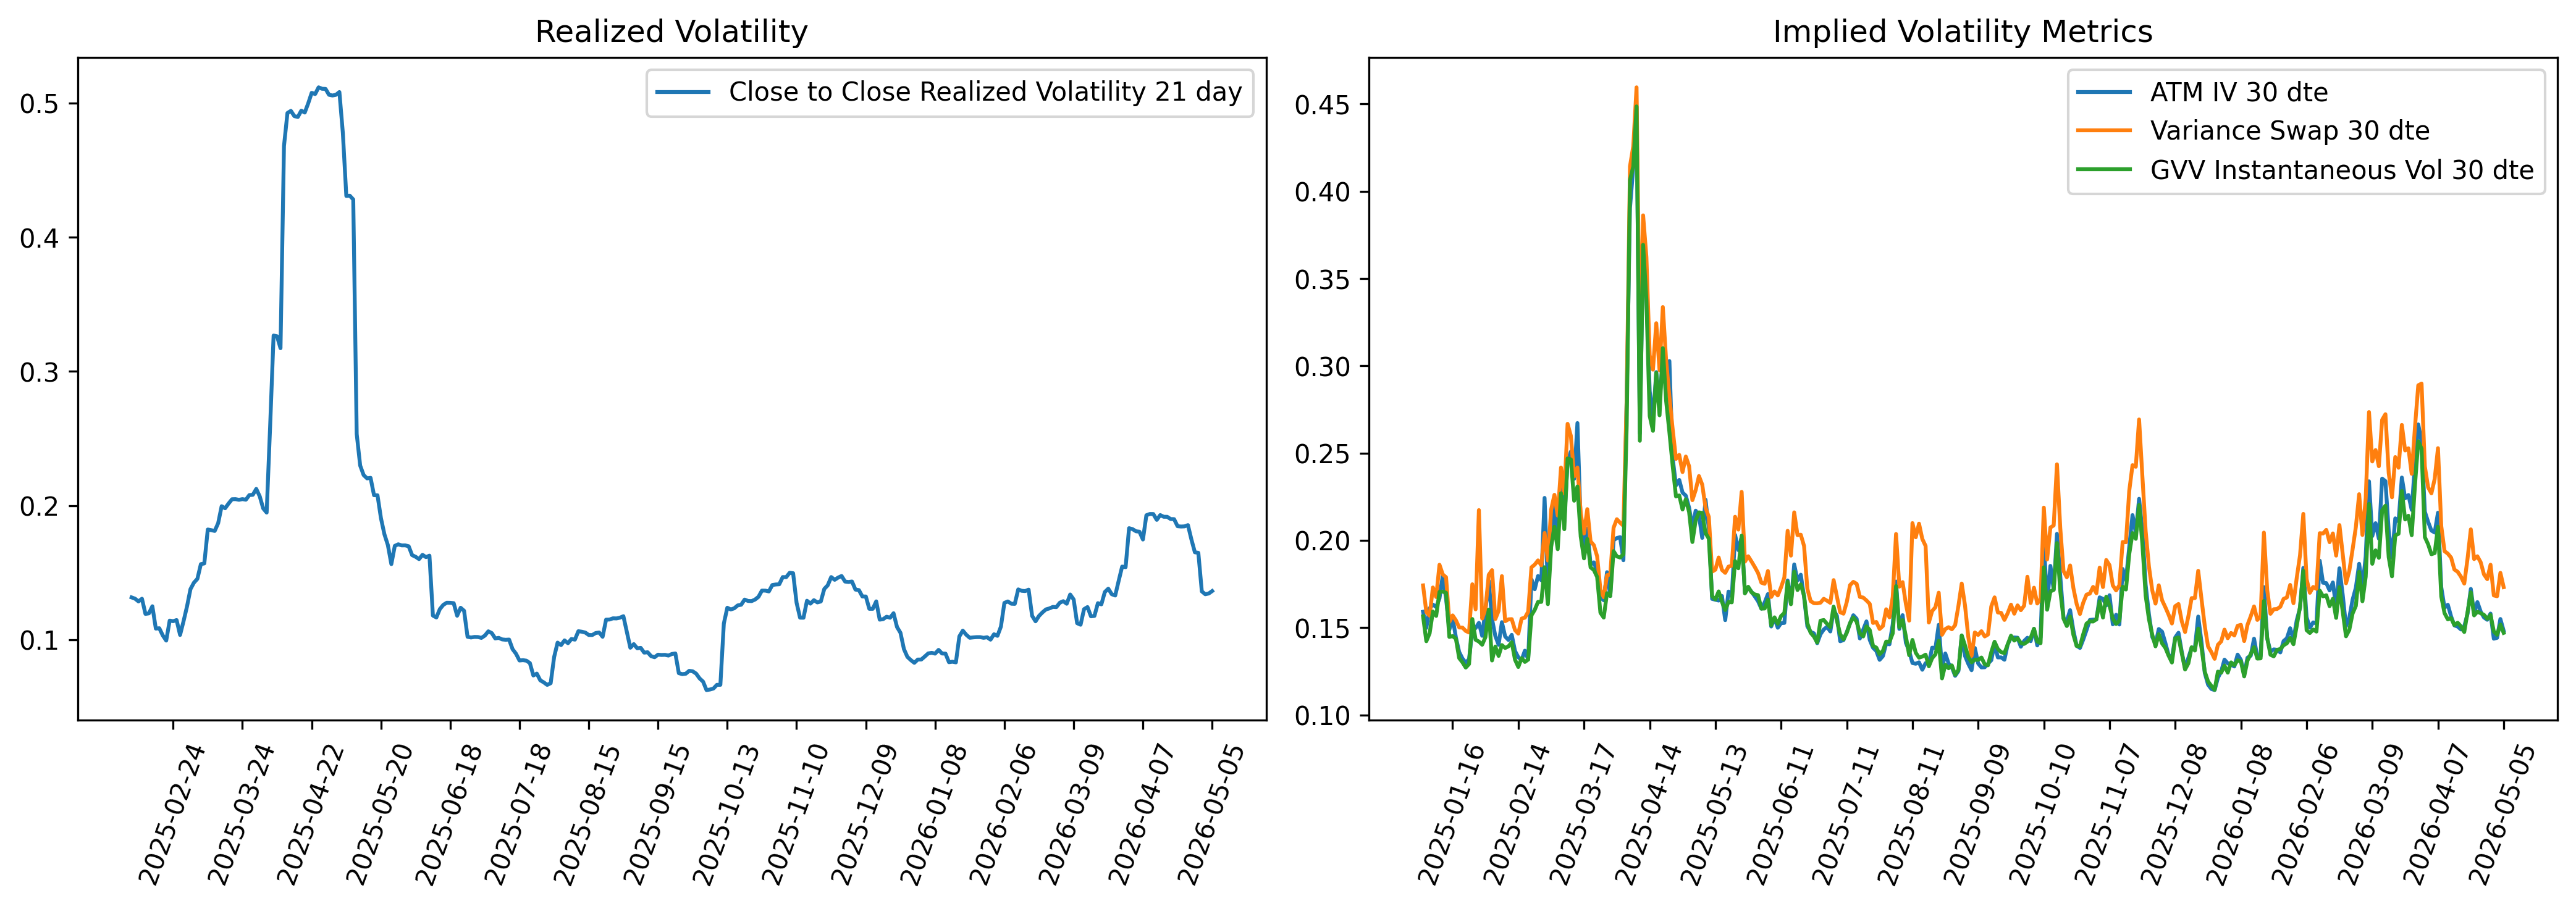
In the below images we have the 21-day rolling realized volatility and three metrics for our implied part, a rolling iv, the rolling fixed leg of a variance swap and the instantaneous vol calculated from the GVV model (more on this in a future post). These are all calculated from a linear interpolation of the 30 dte closest maturity options.
We then find the rolling volatility risk premium using the difference between the fixed leg variance swap strike, and the rolling realized volatility. Note we shift back the realized volatility to match the date projected by the implied.
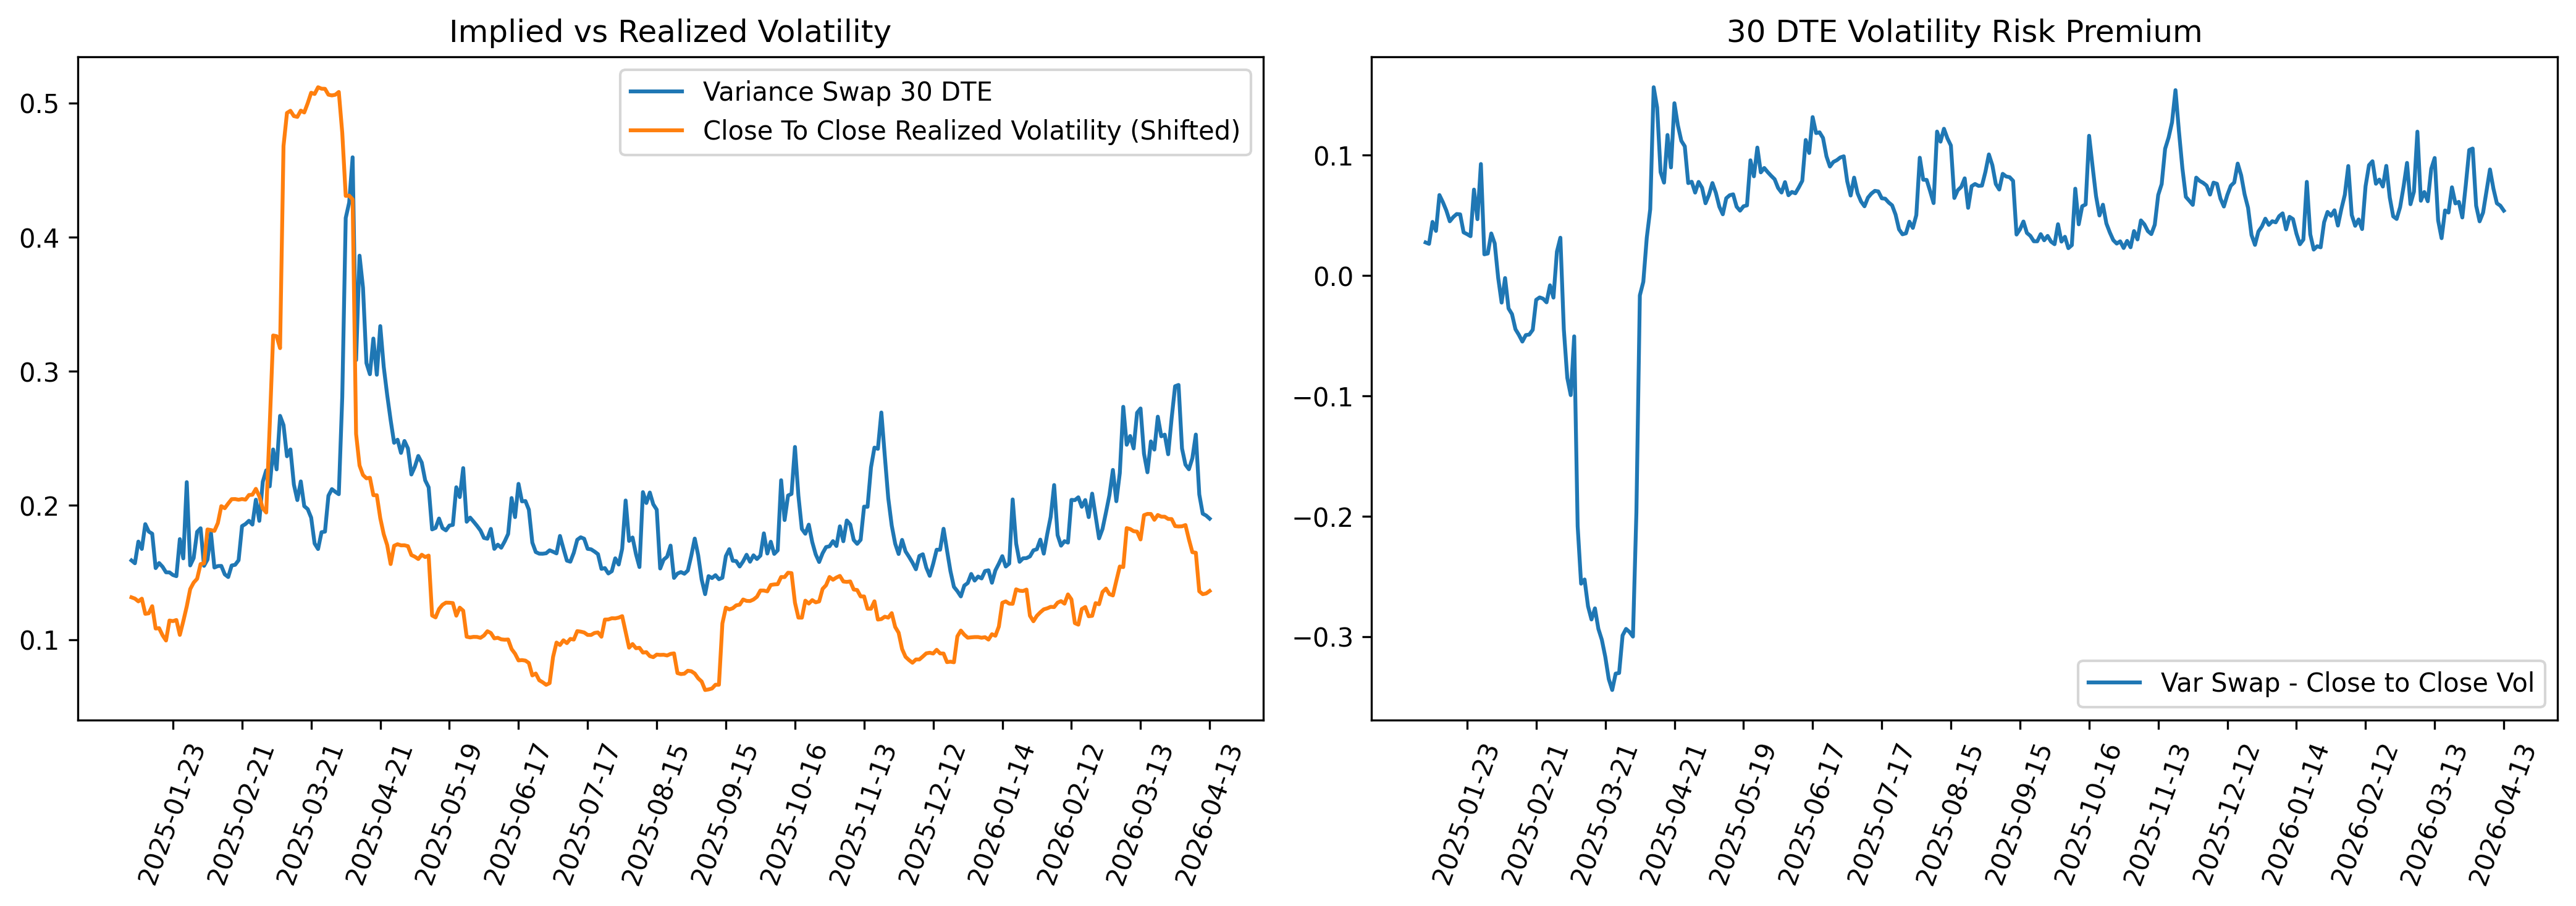
I wont talk any more about the VRP because it is widely talked about and researched and I doubt there is much more value to be added. It is important to note that investors/traders usually harvest the variance risk premium using delta hedged straddles.
Skew/Skewness Risk Premium
If the variance risk premium measures the premium related to dispersion (statistically speaking) then the skewness/skew risk premium measures the premium related to asymmetry. In the realized world skewness risk premiums arise because stock prices and returns fall a lot faster than they rise (asymmetric distribution). In the implied world skew risk premiums arise because of a related reason but better attributed to spot-vol correlation being negative and investors generally buy downside puts and sell upside calls causing a skew (at least in equities). Unlike the VRP there is no agreed upon metric used to quantify this and cannot be measured directly because the conditional physical density is not observable, but I will give a few metrics that can be used to approximate this risk premium. Just like the VRP we define the premia as the difference between expected skewness/skew under the risk-neutral measure (implied) and expected skewness/skew under the physical measure (realized).
\[\text{SRP}_{t,T} = \mathbb{E}^{\mathbb{Q}}_{t} \left[ \text{Skew}_{t,T} \right] - \mathbb{E}^{\mathbb{P}}_{t} \left[ \text{Skew}_{t,T} \right]\]There is a difference between skew and skewness in both the implied and realized sense. This difference is partly terminology and partly mathematical, in practice, people often use them interchangeably and loosely. Generally skew has to do with the shape of the surface/volatility curve and it is linked to risk-neutral skewness but not an exact measurement of it. Where skewness on the other hand directly relates to the third standardized moment of the risk-neutral or physical distribution. This is most obviously seen in our measurements for realized skew and skewness, where realized skew is a metric for the third moment using historical returns scaled by a fixed leg of a variance swap as to incorporate the skew in some way, and realized skewness is a third moment using historical returns scaled by realized volatility. Skew incorporates the curve, skewness is purely the historical returns.
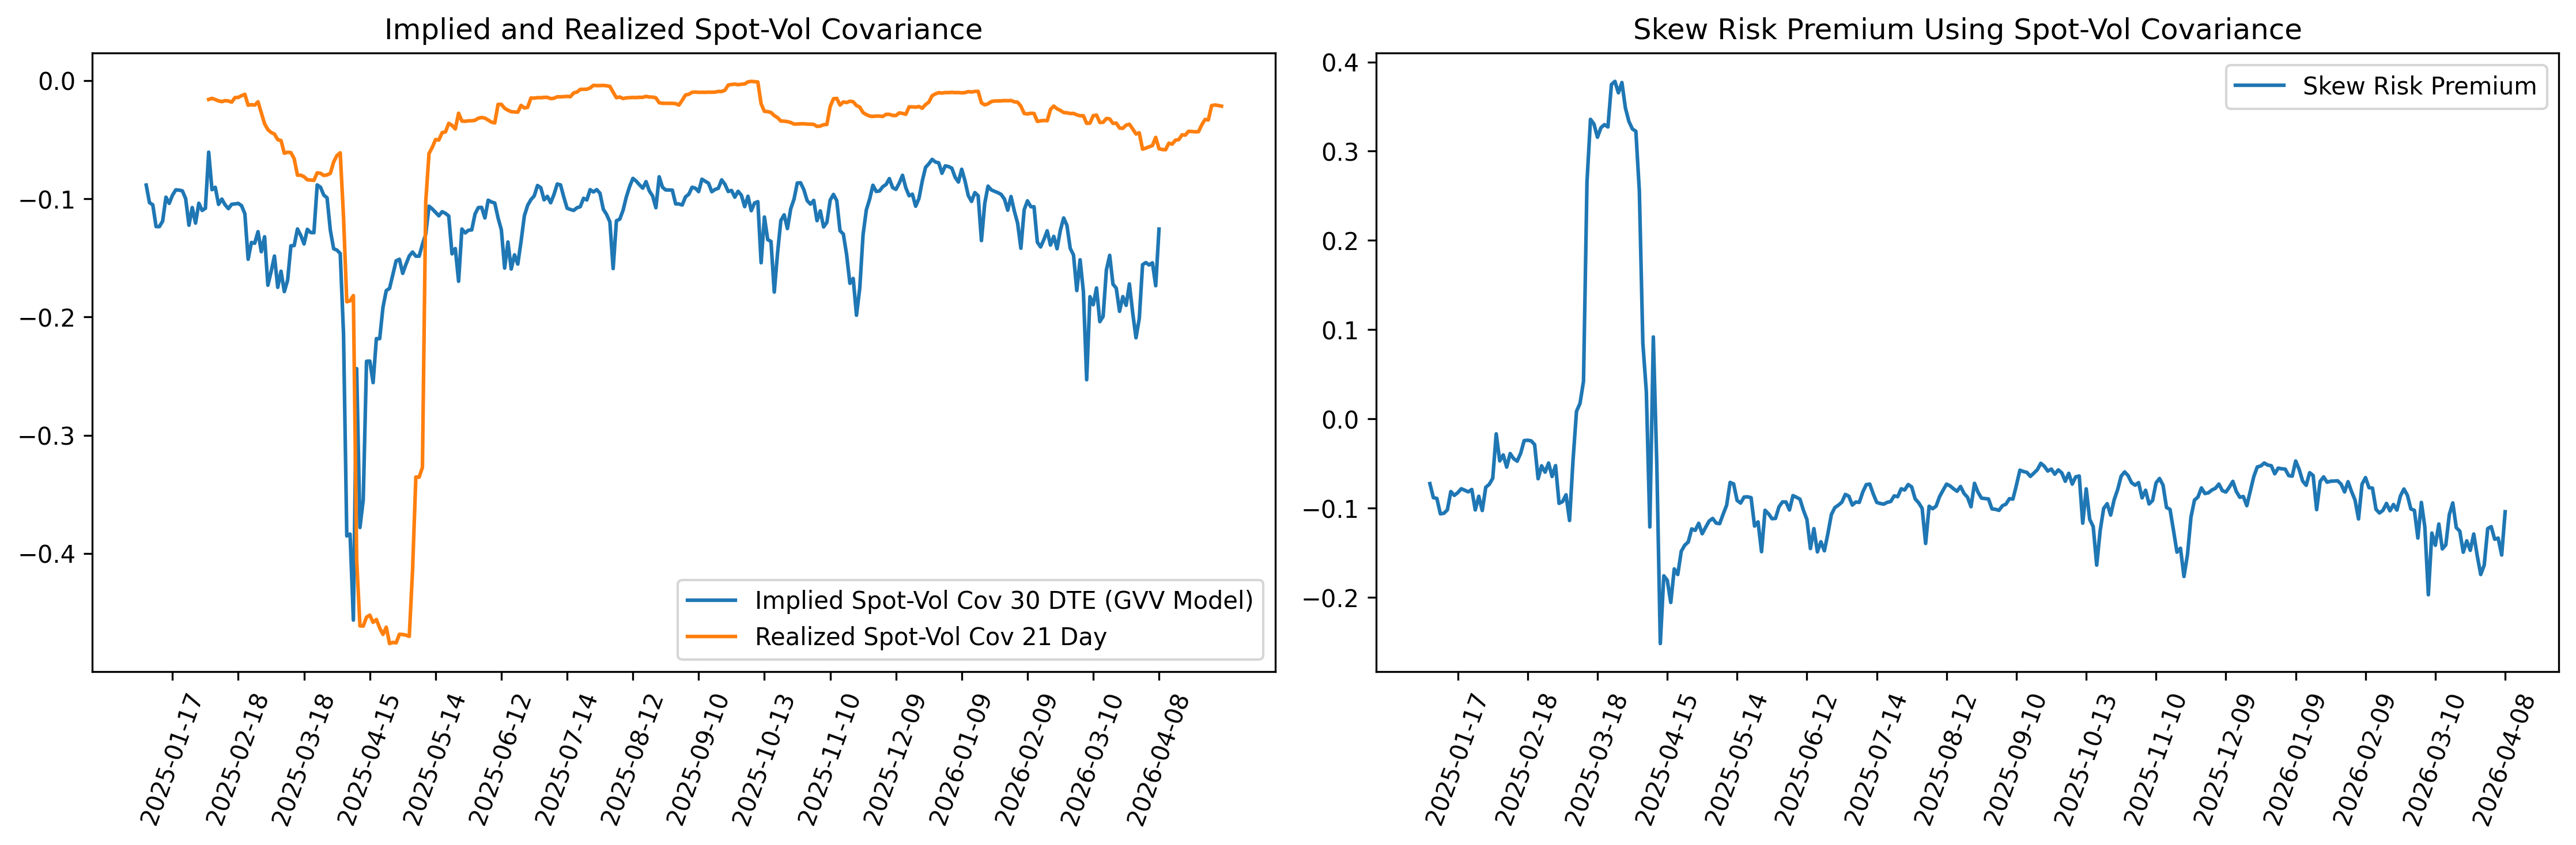
I quantify the skew risk premium using the difference between implied and realized spot-vol covariance as defined below. Implied spot-vol covariance is found from the instantaneous ATM skew of an implied volatility curve. This can be approximated using calibrated implied parameters from a volatility model, in this post I use SABR and GVV volatility models.
\[d\langle \log S,\sigma\rangle_t = \rho_{S,\sigma}\,\sigma_t\,\nu_t\,dt\]And realized spot-vol covariance (also called realized skew) is the historical covariance between instantaneous vol and log returns
\[\sum_{i=1}^{N} \ln\left(\frac{S_i}{S_{i-1}}\right)\Delta \hat{\sigma}_i\]Below we show a plot of these metrics and their associated skew risk premium.
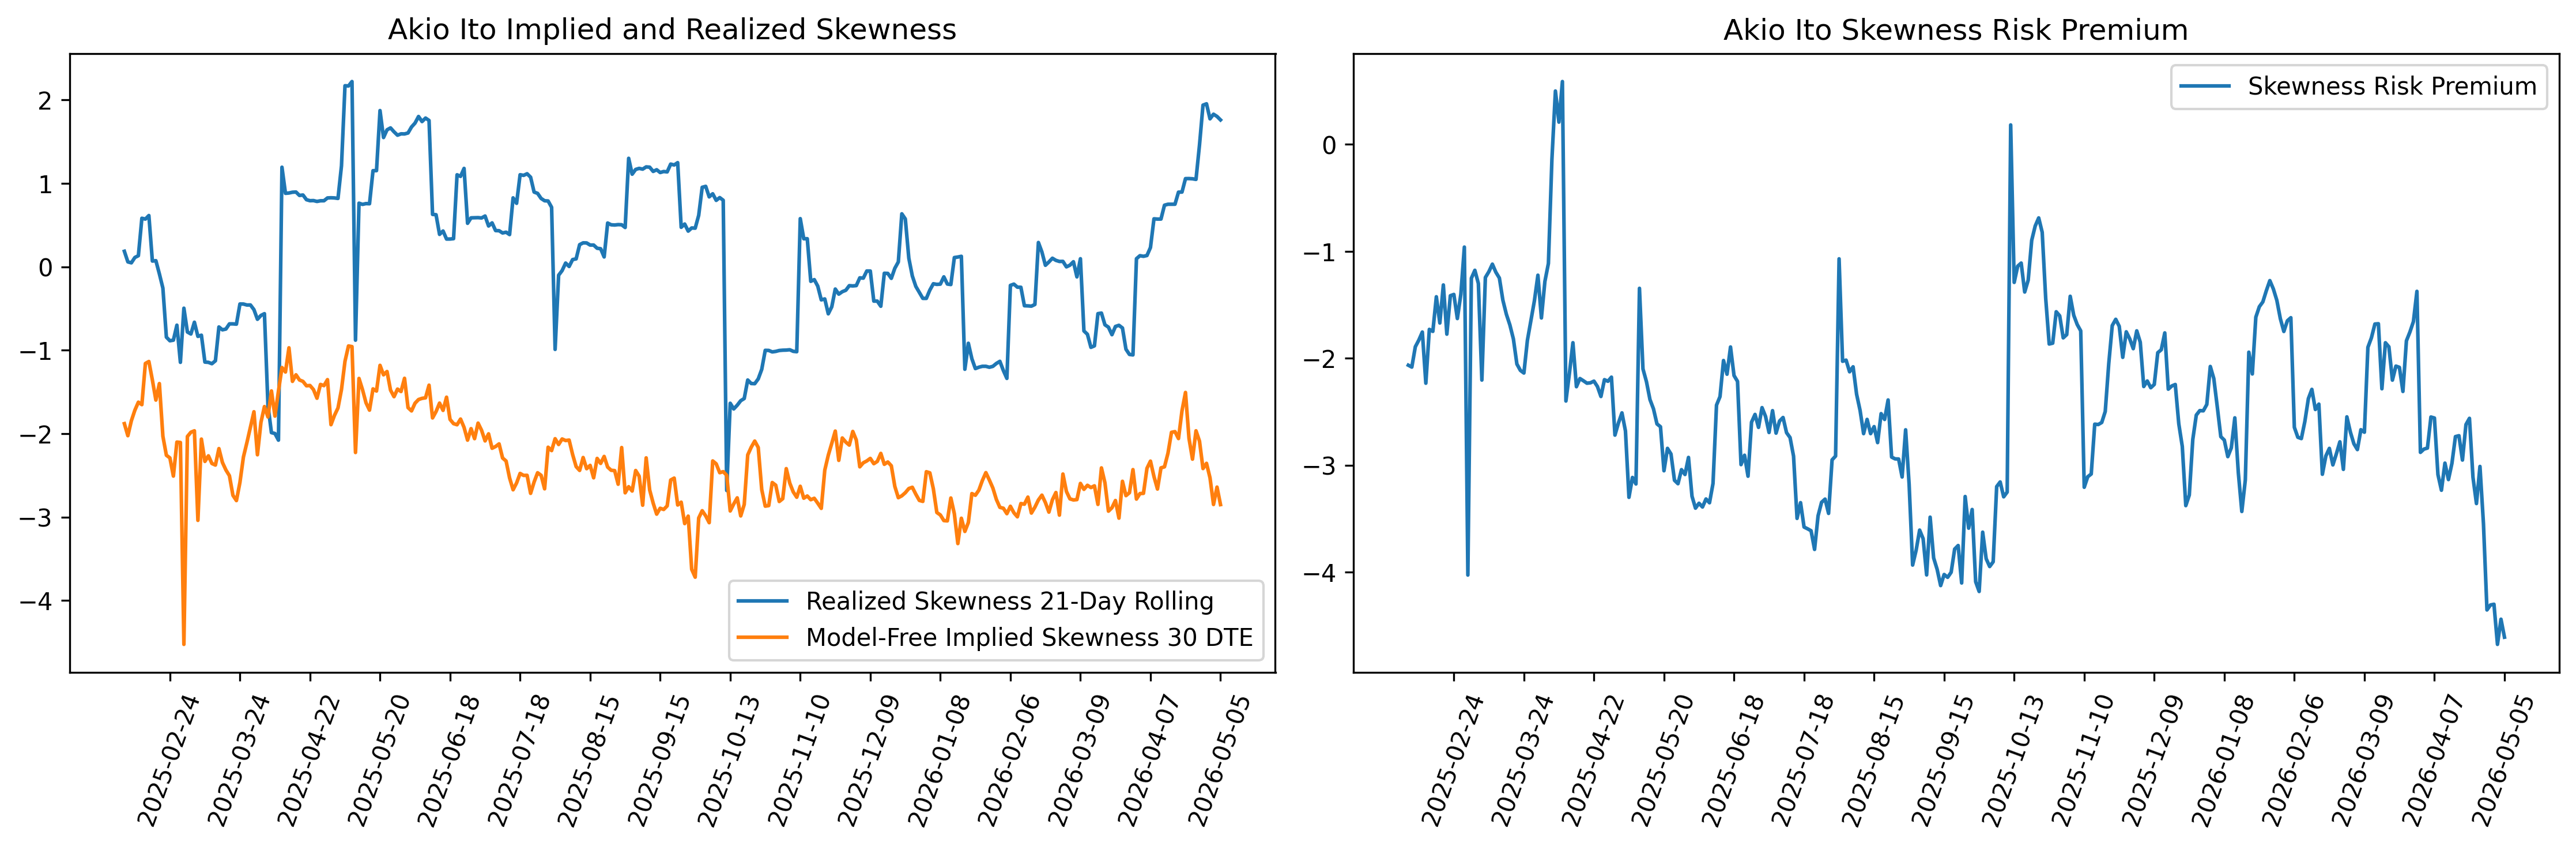
To quantify skewness risk premium I use implied skewness minus realized skewness but I need to add a little detail about the calculation of those two metrics.
Implied skewness is a model-free metric derived from OTM puts and calls, I follow the skew-swap framework of Kozhan, Neuberger, and Schneider (2012) and Ito (2025) to derive this. Under these frameworks implied skewness is essentially the fixed leg of a skew swap divided by a variance/log contract.
Neuberger directly defines the fixed leg of a skew swap as an entropy contract minus a log contract.
- Kozhan, Neuberger, and Schneider (2012)
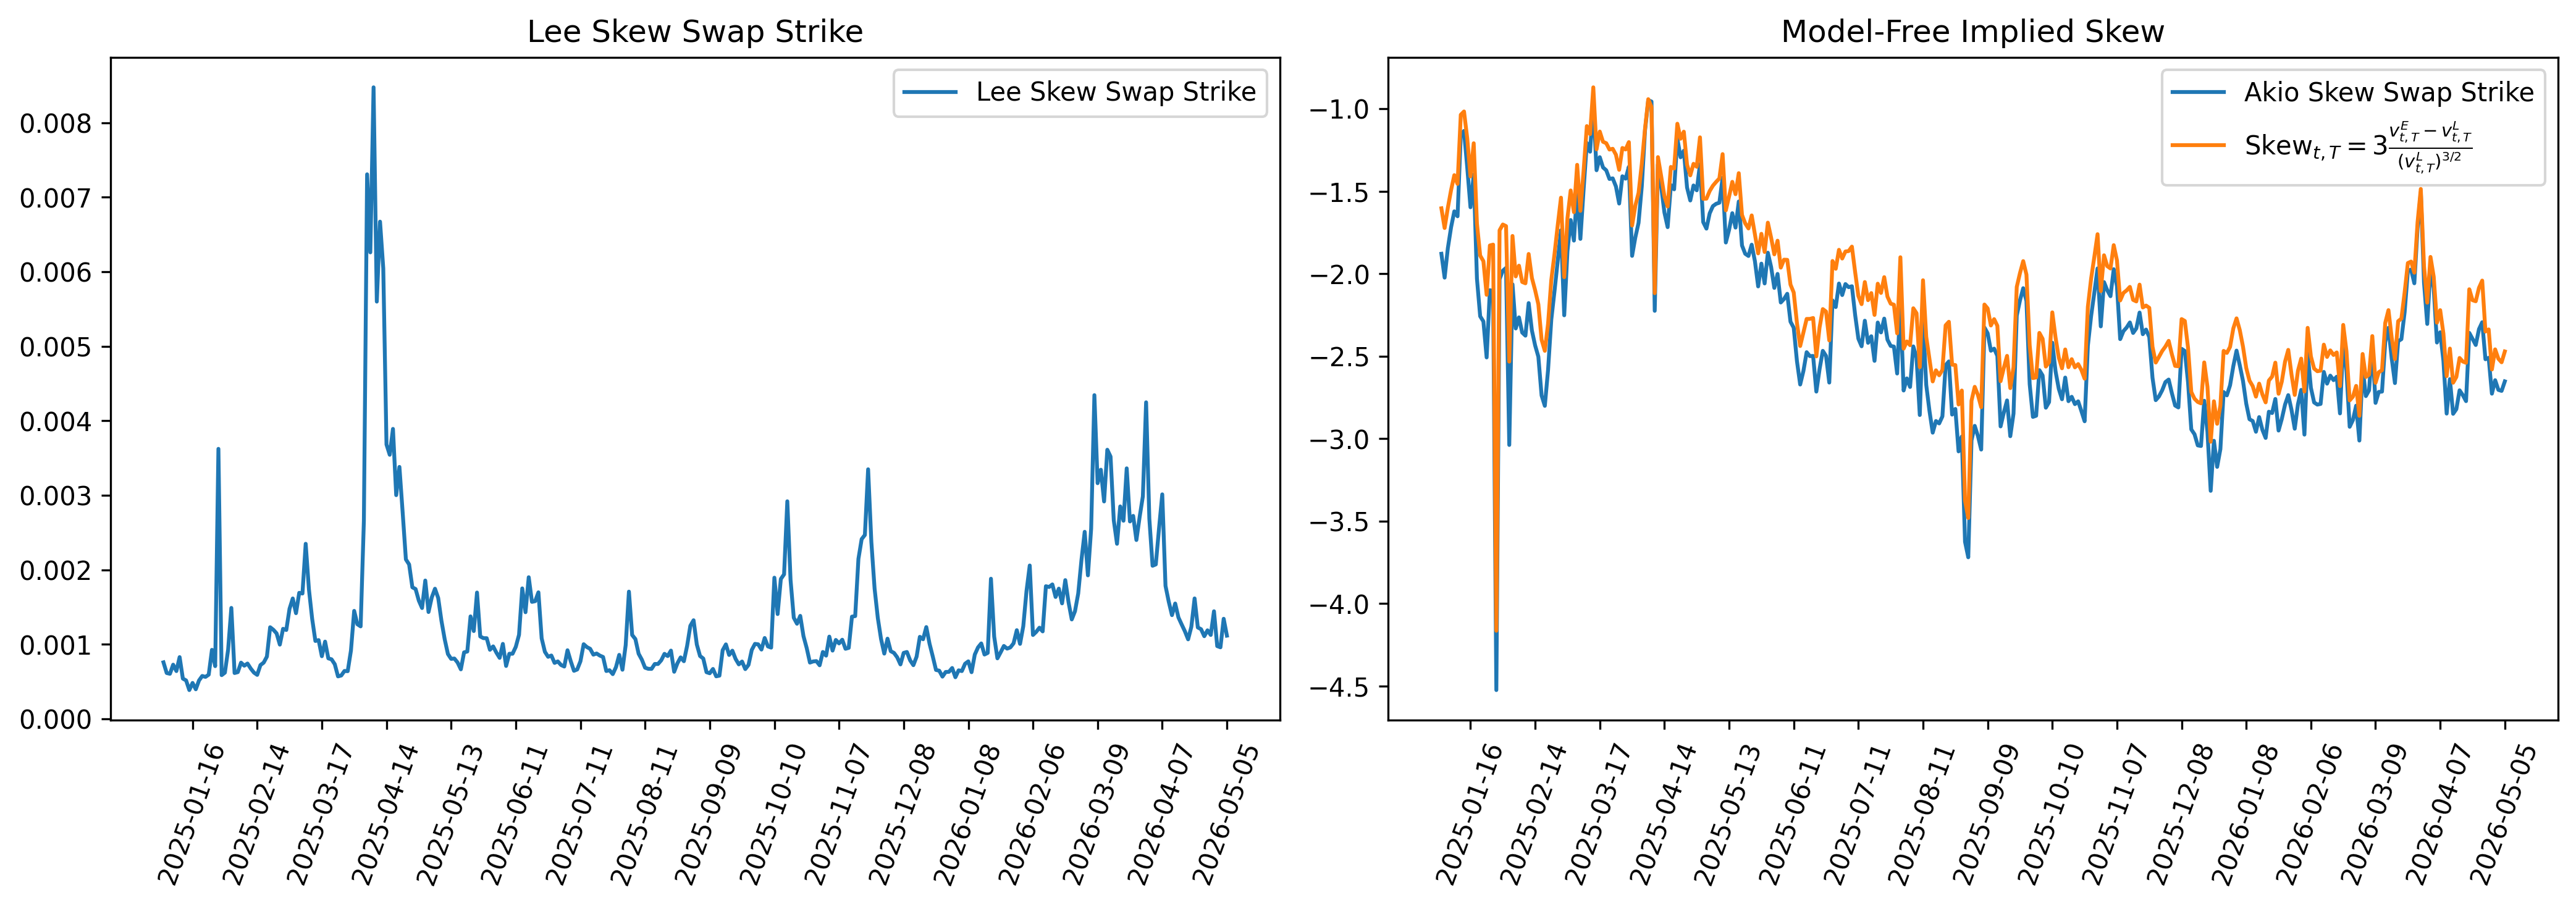
And Ito (2025) uses a similar formulation. The fixed leg of a skew swap can also be defined as a specific weighting of OTM puts and calls. The below formula is exactly the same as an entropy contract minus a log contract. This formula was derived following Lee (2024)
\[K_s = \frac{2}{T S_0} \left( \int_{0}^{S_0} \operatorname{put}(S_0, K) \frac{1}{K^2} (S_0 - K)\, dK + \int_{S_0}^{\infty} \operatorname{call}(S_0, K) \frac{1}{K^2} (S_0 - K)\, dK \right)\]I plot these below using daily S&P 500 options data and as you can see both Ito and Neuberger’s frameworks are in line over time. You can find the code implementation on my GitHub under py_op
Realized skewness is estimated from the historical distribution of log returns. Following Ito (2025), it is measured using cubed intraday log returns scaled by realized variance, so it can be interpreted as the standardized third moment of the return distribution.
\[\frac{\sqrt{N}\sum_{i=1}^{N} r_i^3} {\left(\sum_{i=1}^{N} r_i^2\right)^{3/2}}\]Ito (2025) then quantifies skewness risk premium by subtracting the implied and realized legs.
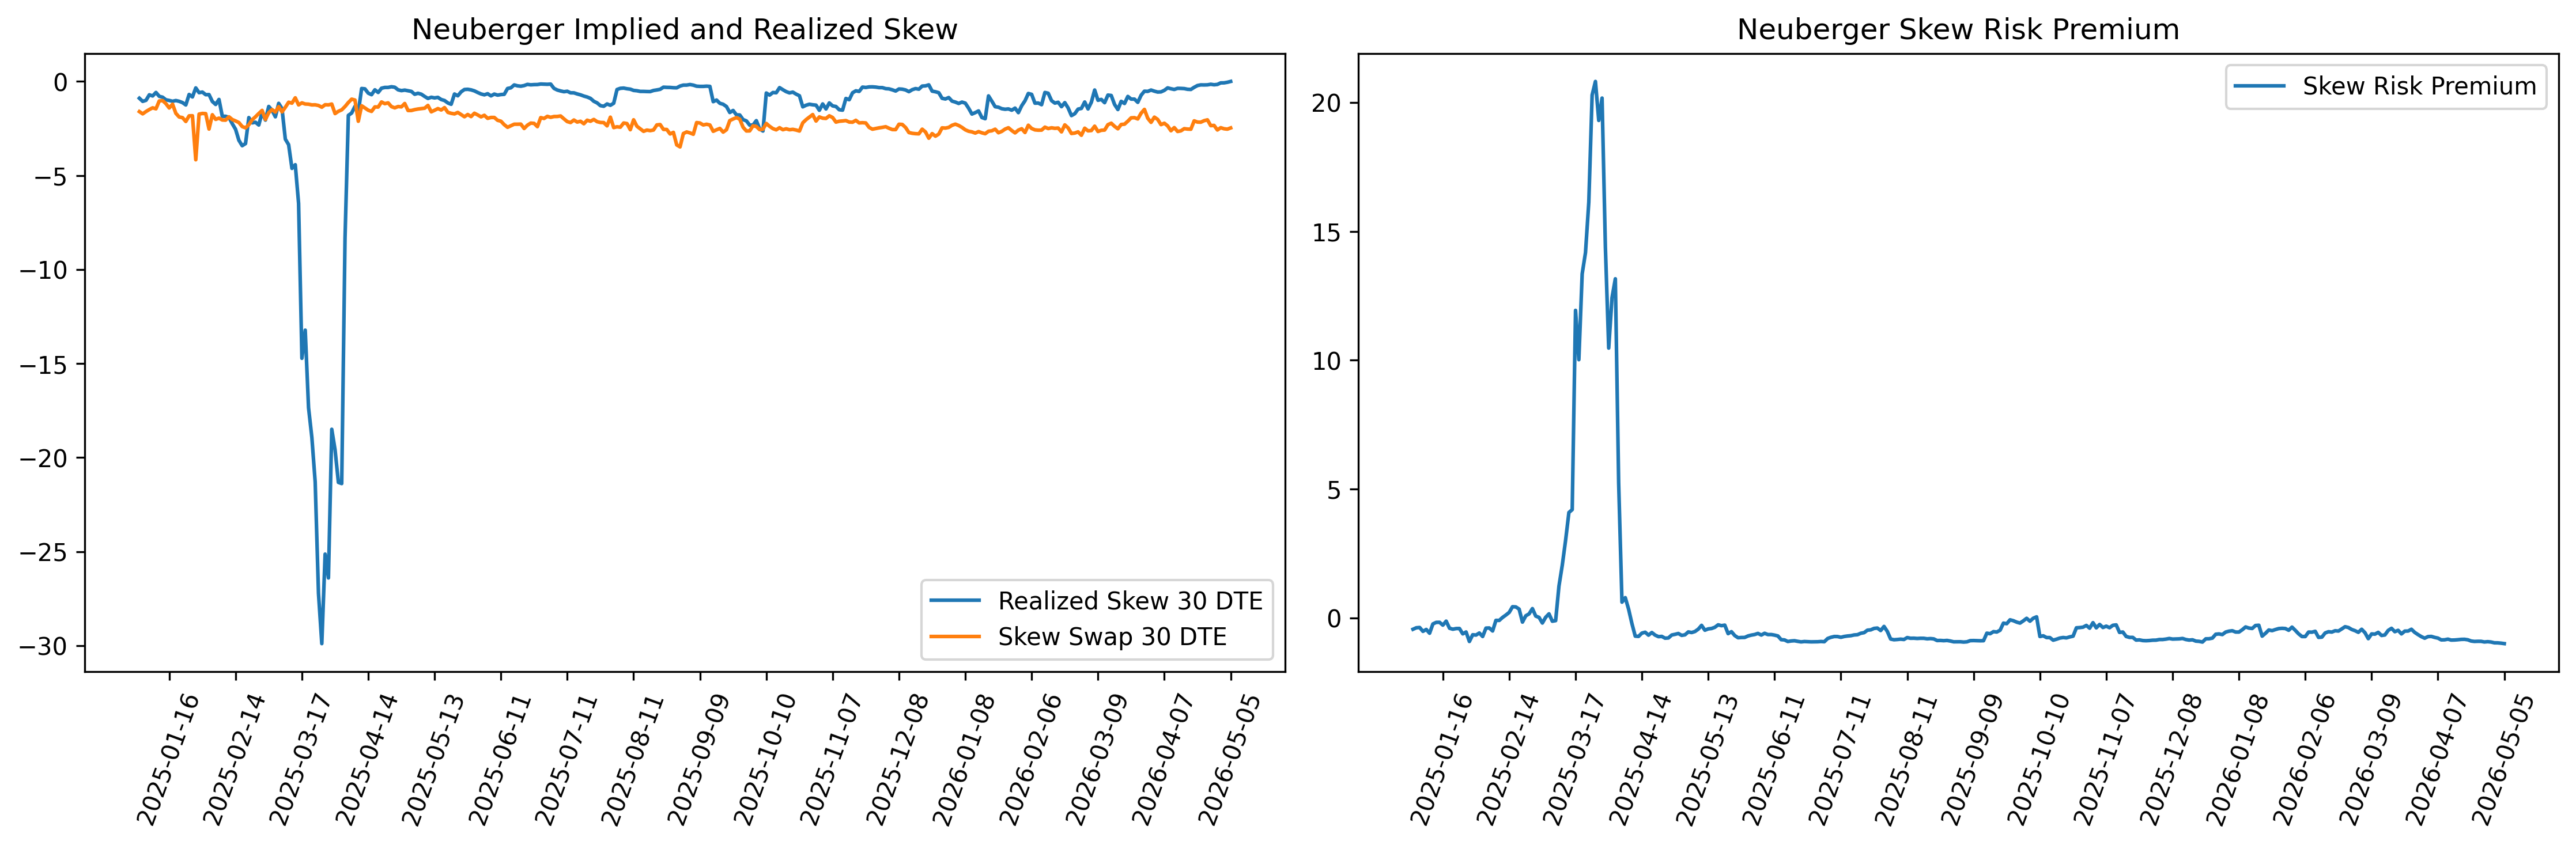
Kozhan, Neuberger, and Schneider (2012) use a slightly different approach. It is important to note their paper claims to be estimating skew risk premium not skewness even though they use the same fixed leg of a skew swap as Ito, this is exactly where the nomenclature around skew and skewness gets messy. What is important to remember is essentially any framework around a higher moment risk premium is always estimating an implied minus realized value, and importantly both derivations claim these correspond to a fixed leg and floating leg of a skew swap. The floating leg of their skew swap estimate of skewness risk premium, as we already defined above is some statistical estimate of a third moment scaled by a variance swap fixed leg and they define it as realized skew as well.
\[\operatorname{rskew}_{t,T} = \frac{rs_{t,T}}{\left(v^{L}_{t,T}\right)^{3/2}}\] \[rs_{t,T} = \sum_{i=t}^{T} \left[ \delta v^{E}_{i,T} \left(e^{r_{i,i+1}} - 1\right) + 6 \left( 2 - 2e^{r_{i,i+1}} + r_{i,i+1} + r_{i,i+1}e^{r_{i,i+1}} \right) \right]\]This is actually very similar to the realized skewness third moment definition defined above except we are dividing by a different form of variance derived from a skew curve. They then go on to define skew risk premium as rskew/skew - 1, and we plot these below.
Based on the above metrics we have three different measurements for our risk premium.
- Implied spot-vol covariance - realized spot-vol covariance
- Model-free implied skewness (ie scaled fixed leg skew swap) - realized skewness from historical log returns
- Model-free implied skewness (ie scaled fixed leg skew swap) - realized skew (ie floating leg skew swap)
Under these frameworks the risk premium can be interpreted as the expected payoff of a skew swap. Most traders capture the premia using option structures like delta hedged risk reversals or some weighting of short OTM puts and long OTM calls.
Before we move on to vol-of-vol risk premium there are some other metrics related to skew I would like to briefly discuss. These metrics are the implied and realized spot-vol correlation and a Normalized 90% - 110% moneyness IV skew slope. These are also metrics that are commonly used by volatility traders to estimate some form of co-movement in spot and vol and are important to know. Below we show rolling metrics for realized and implied spot-vol correlation, where the realized correlation is estimated using historical log returns and ATM IV and the implied correlation is estimated using a calibrated parameter from a stochastic volatility model, or directly taken from the skew curve.
-
Normalized 90% - 110% moneyness IV skew slope
\[\frac{\text{90 put IV} - \text{110 call IV}} {\left(\text{90 put strike} - \text{110 call strike}\right) / F}\] -
A lot of sources like Natenberg’s book call 90% put IV - 110% call IV (similar for 25 delta) implied skewness, like I said the nomenclature gets messy I consider this skew but as long as you know what you are calculating and understand math I think it is fine.
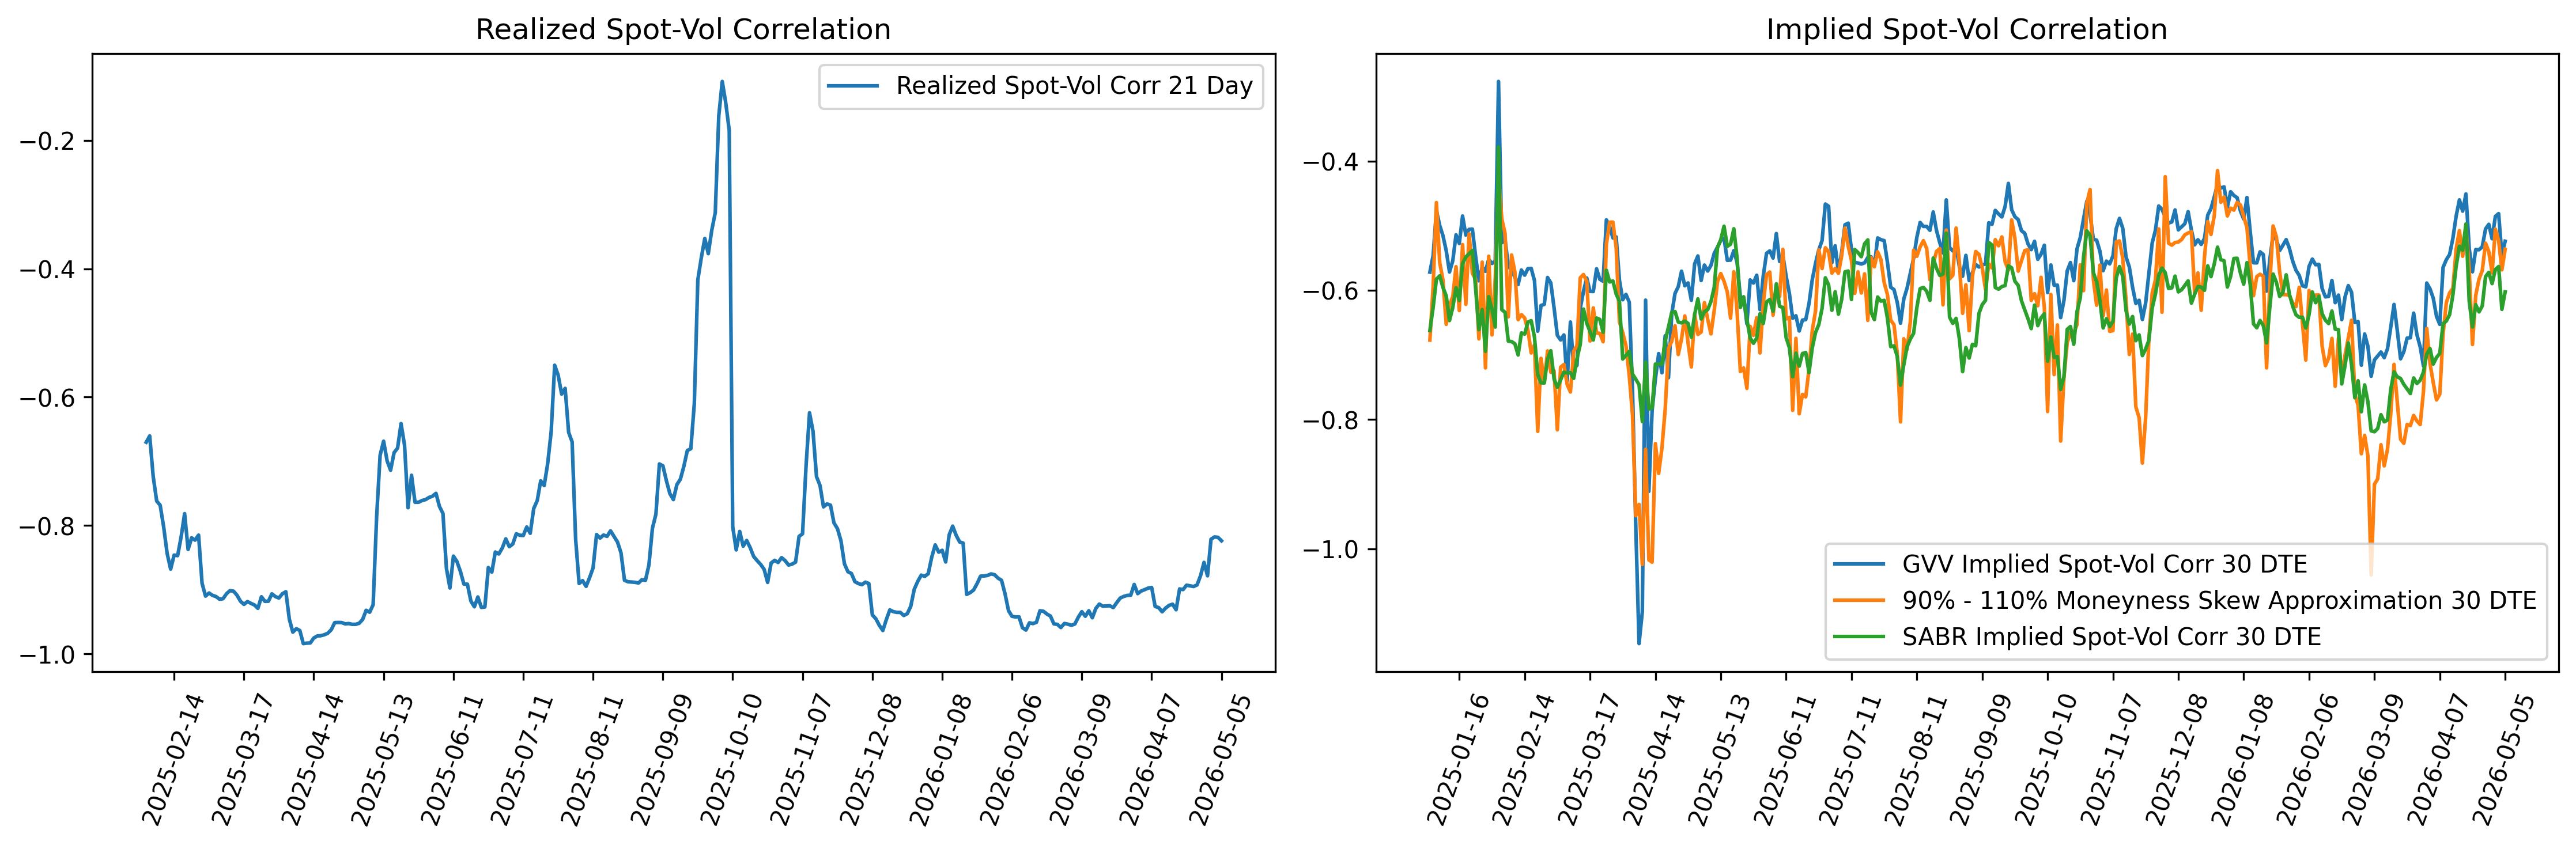
Notice how closely the different implied spot-vol correlation measures track each other. The GVV estimate, SABR estimate, and the 90%-110% moneyness skew approximation all show similar dynamics, suggesting that each method is capturing a similar implied spot-vol relationship
Of all the volatility surface related premia discussed in this post, the skew, or skewness, risk premium has the least consensus around how it should be estimated. Hopefully, this section outlined a few useful metrics that you can apply in your own research. Now, we move on to the final premium I want to discuss, the volatility-of-volatility risk premium.
Volatility of Volatility Risk Premium (VVRP)
Similar to the skew risk premium, there is no single consensus metric for estimating the vol-of-vol risk premium. Vol-of-vol is generally related to the statistical moment kurtosis, and implied/realized vol-of-vol and kurtosis are used loosely and interchangeably. Vol-of-vol is not itself the same as kurtosis, but in stochastic volatility models, higher vol-of-vol tends to generate fatter tails and higher risk-neutral kurtosis. In the literature, implied kurtosis is more akin to implied skew where it can be estimated using implied volatilities for certain OTM options, whereas implied vol-of-vol is generally some parameter from a model. We will discuss multiple methods for calculating all these below. Traders can harvest the vol-of-vol risk premia by trading delta-hedged butterflies or other related option structures.
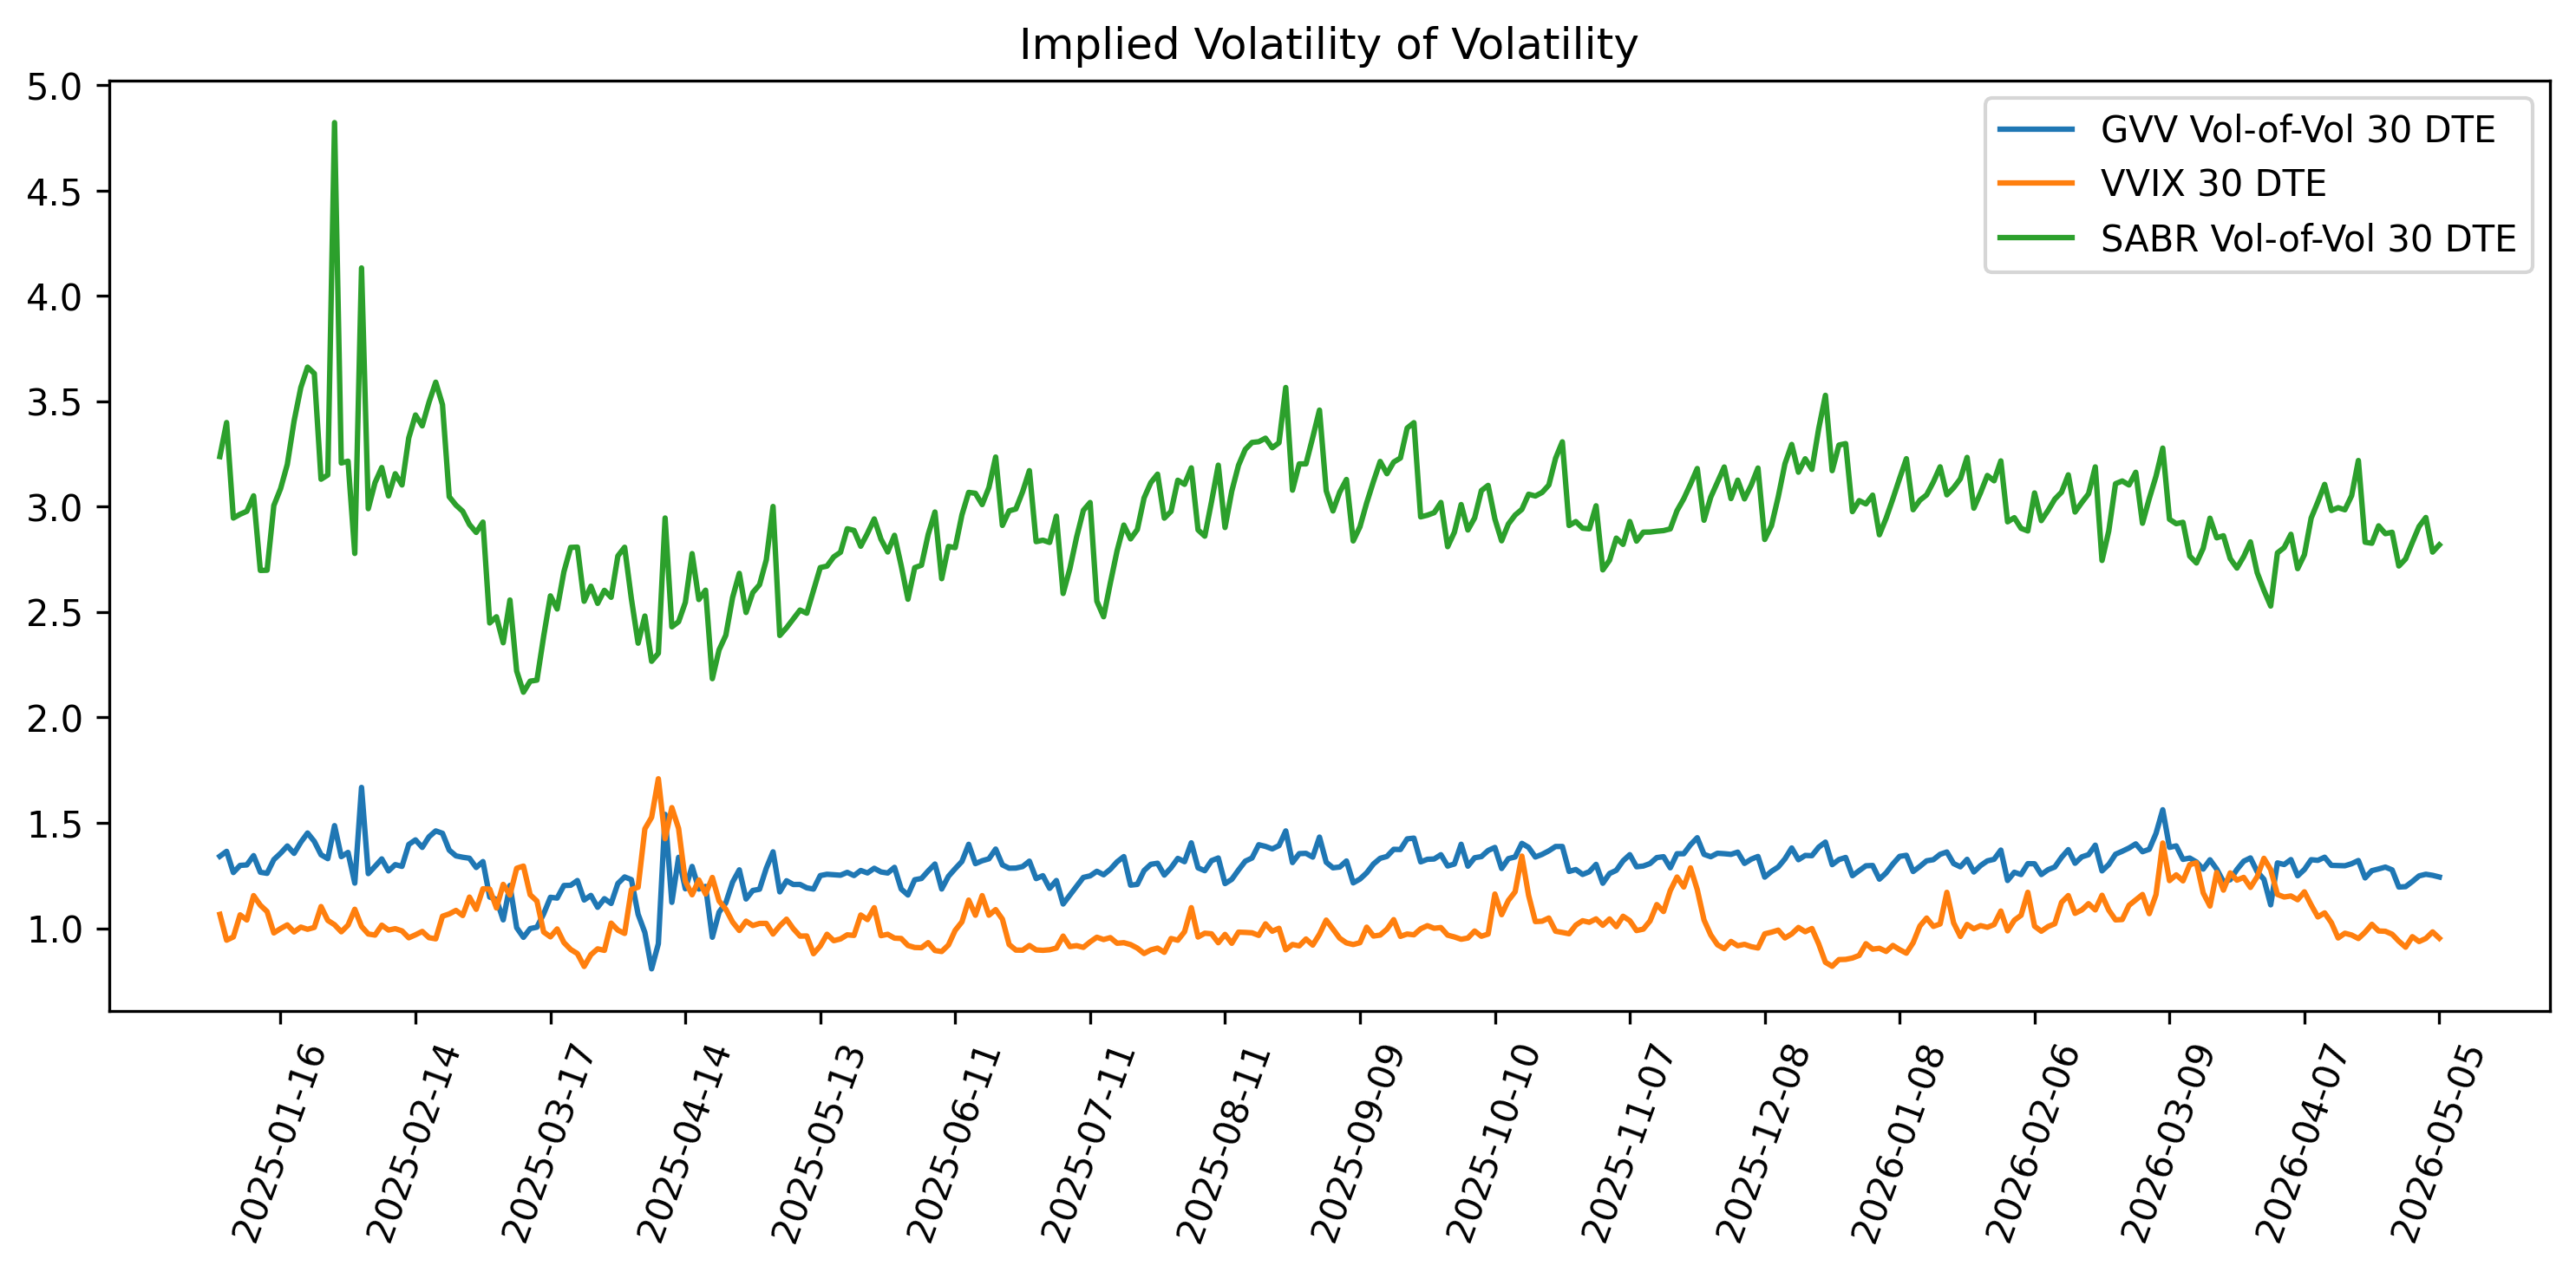
Implied Vol-of-Vol:
- GVV estimated implied vol-of-vol parameter
- SABR estimated implied vol-of-vol parameter
- VVIX Index
Vol-of-vol from GVV and SABR are implied parameters and are derived by using a calibration or numerical procedure to fit a stochastic volatility model and back out their values. Alternatively VVIX is a model free apoproach to estimate implied vol-of-vol using the same variance swap fixed leg calculation on OTM puts and calls on the VIX index.
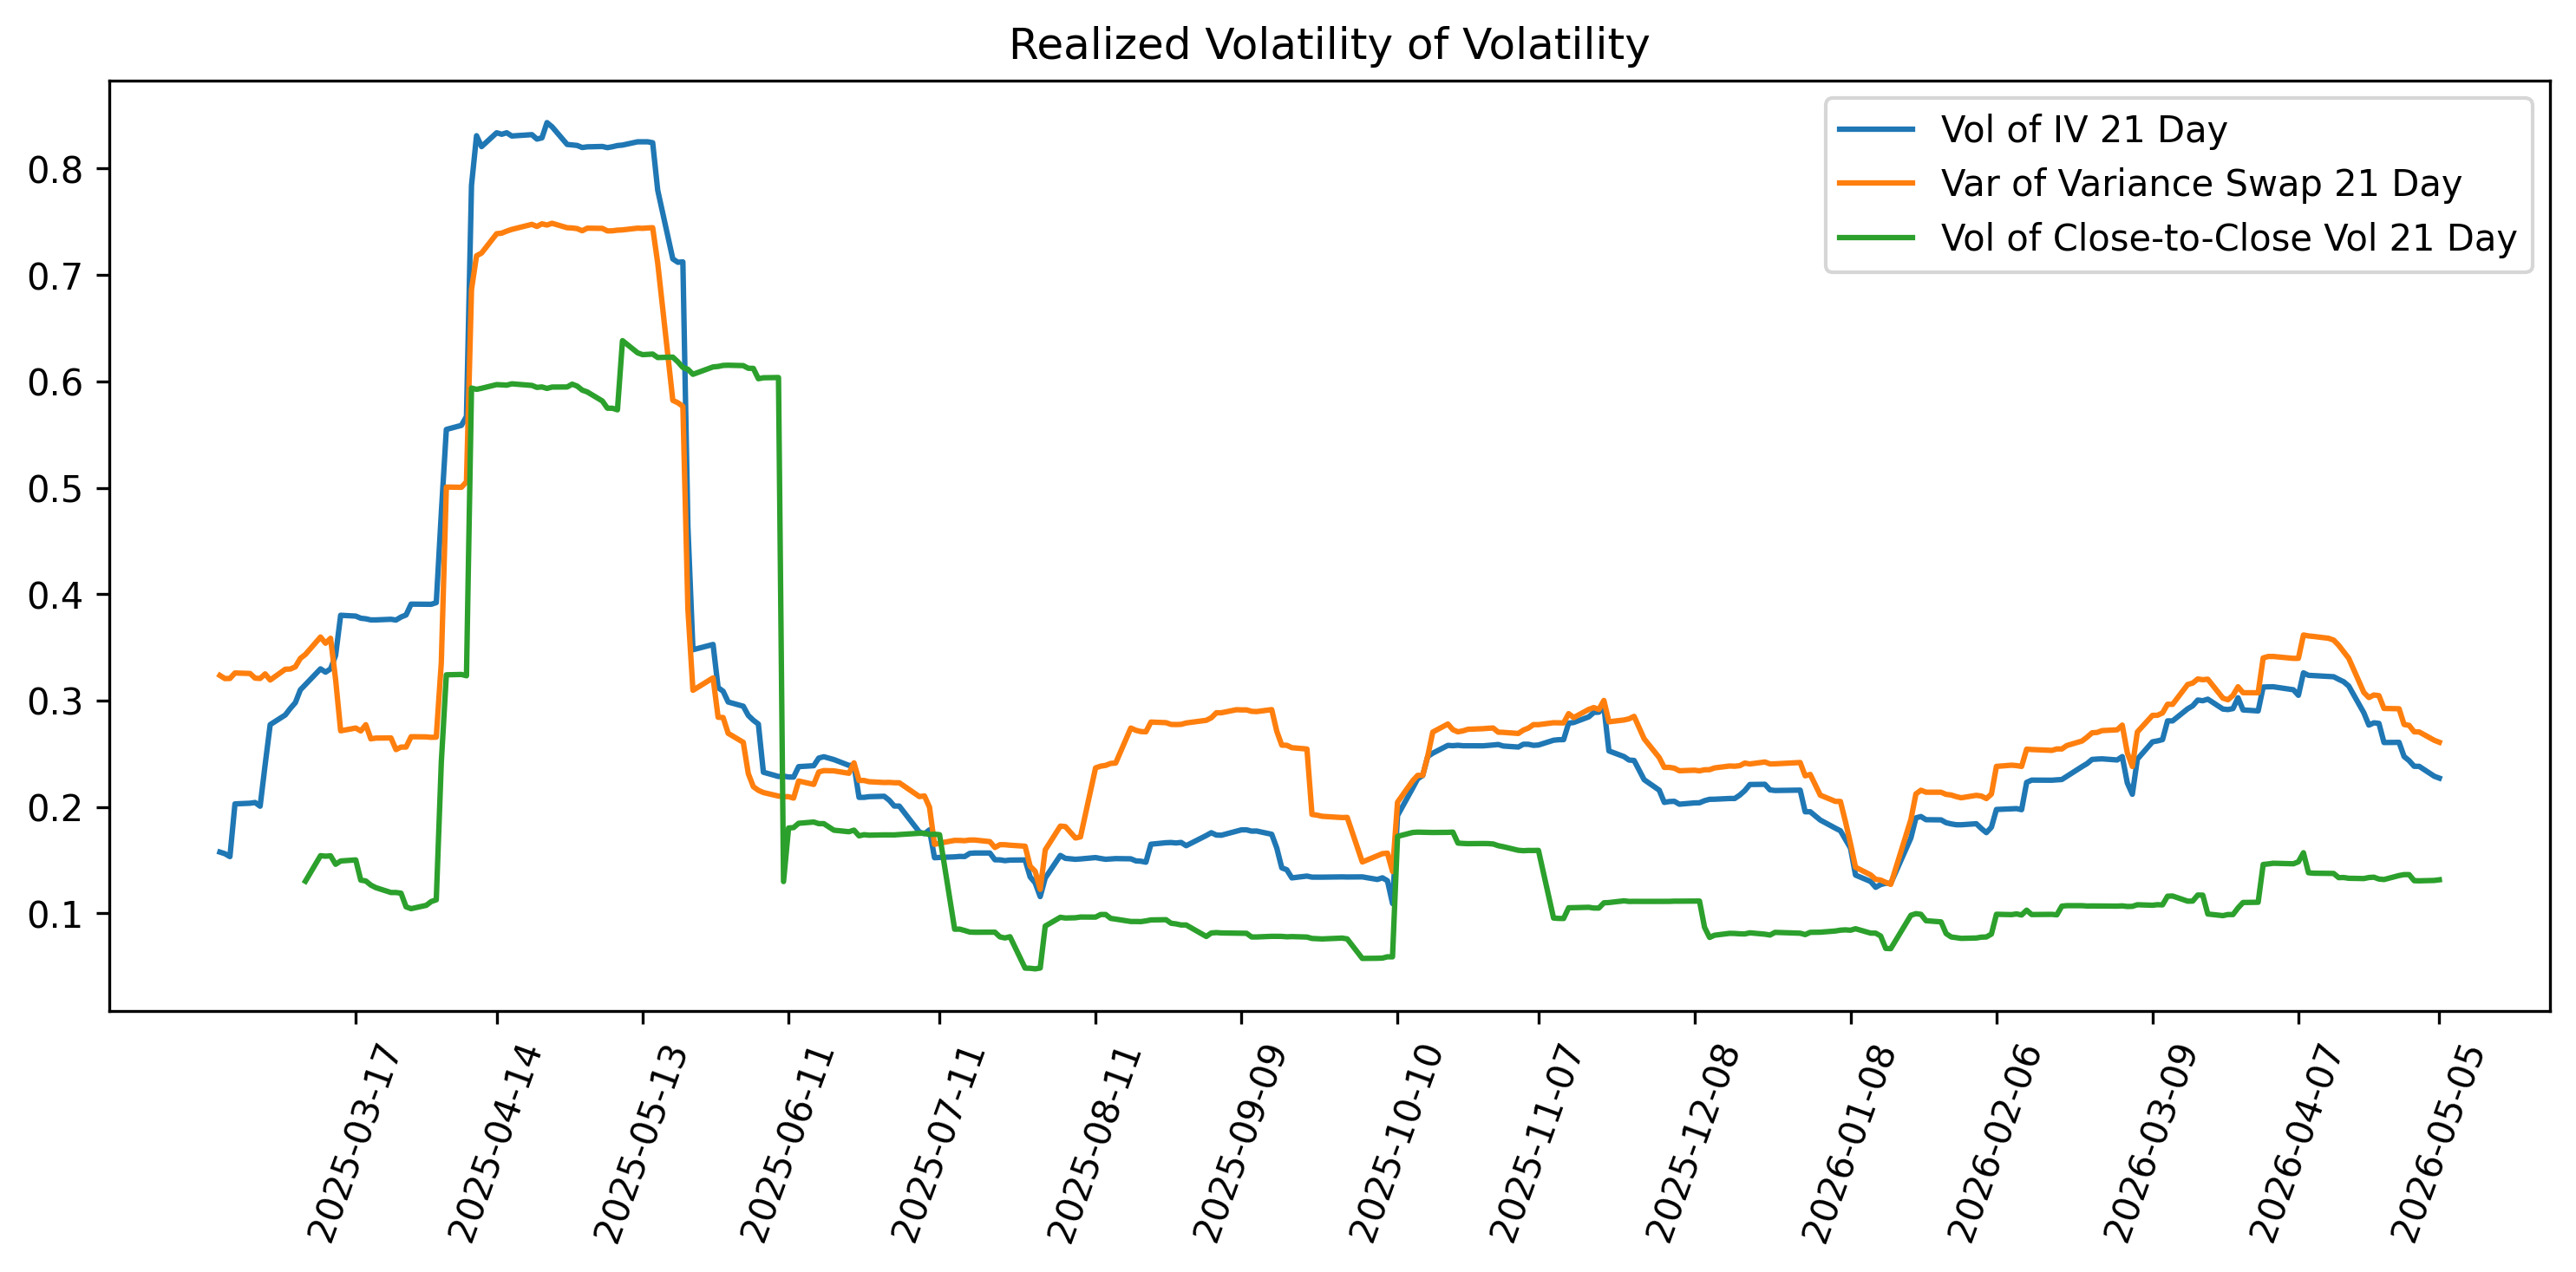
Realized Vol-of-Vol:
- Rolling historical volatility of Implied volatility
- Rolling historical volatility of a Variance Swap
- Rolling historical volatility of the close-to-close volatility estimate
- Rolling historical volatility of VIX Future
Similar to a rolling realized volatility calculation, realized vol-of-vol can be calculated using a historical rolling statistical estimate of volatility on some estimate of volatility.
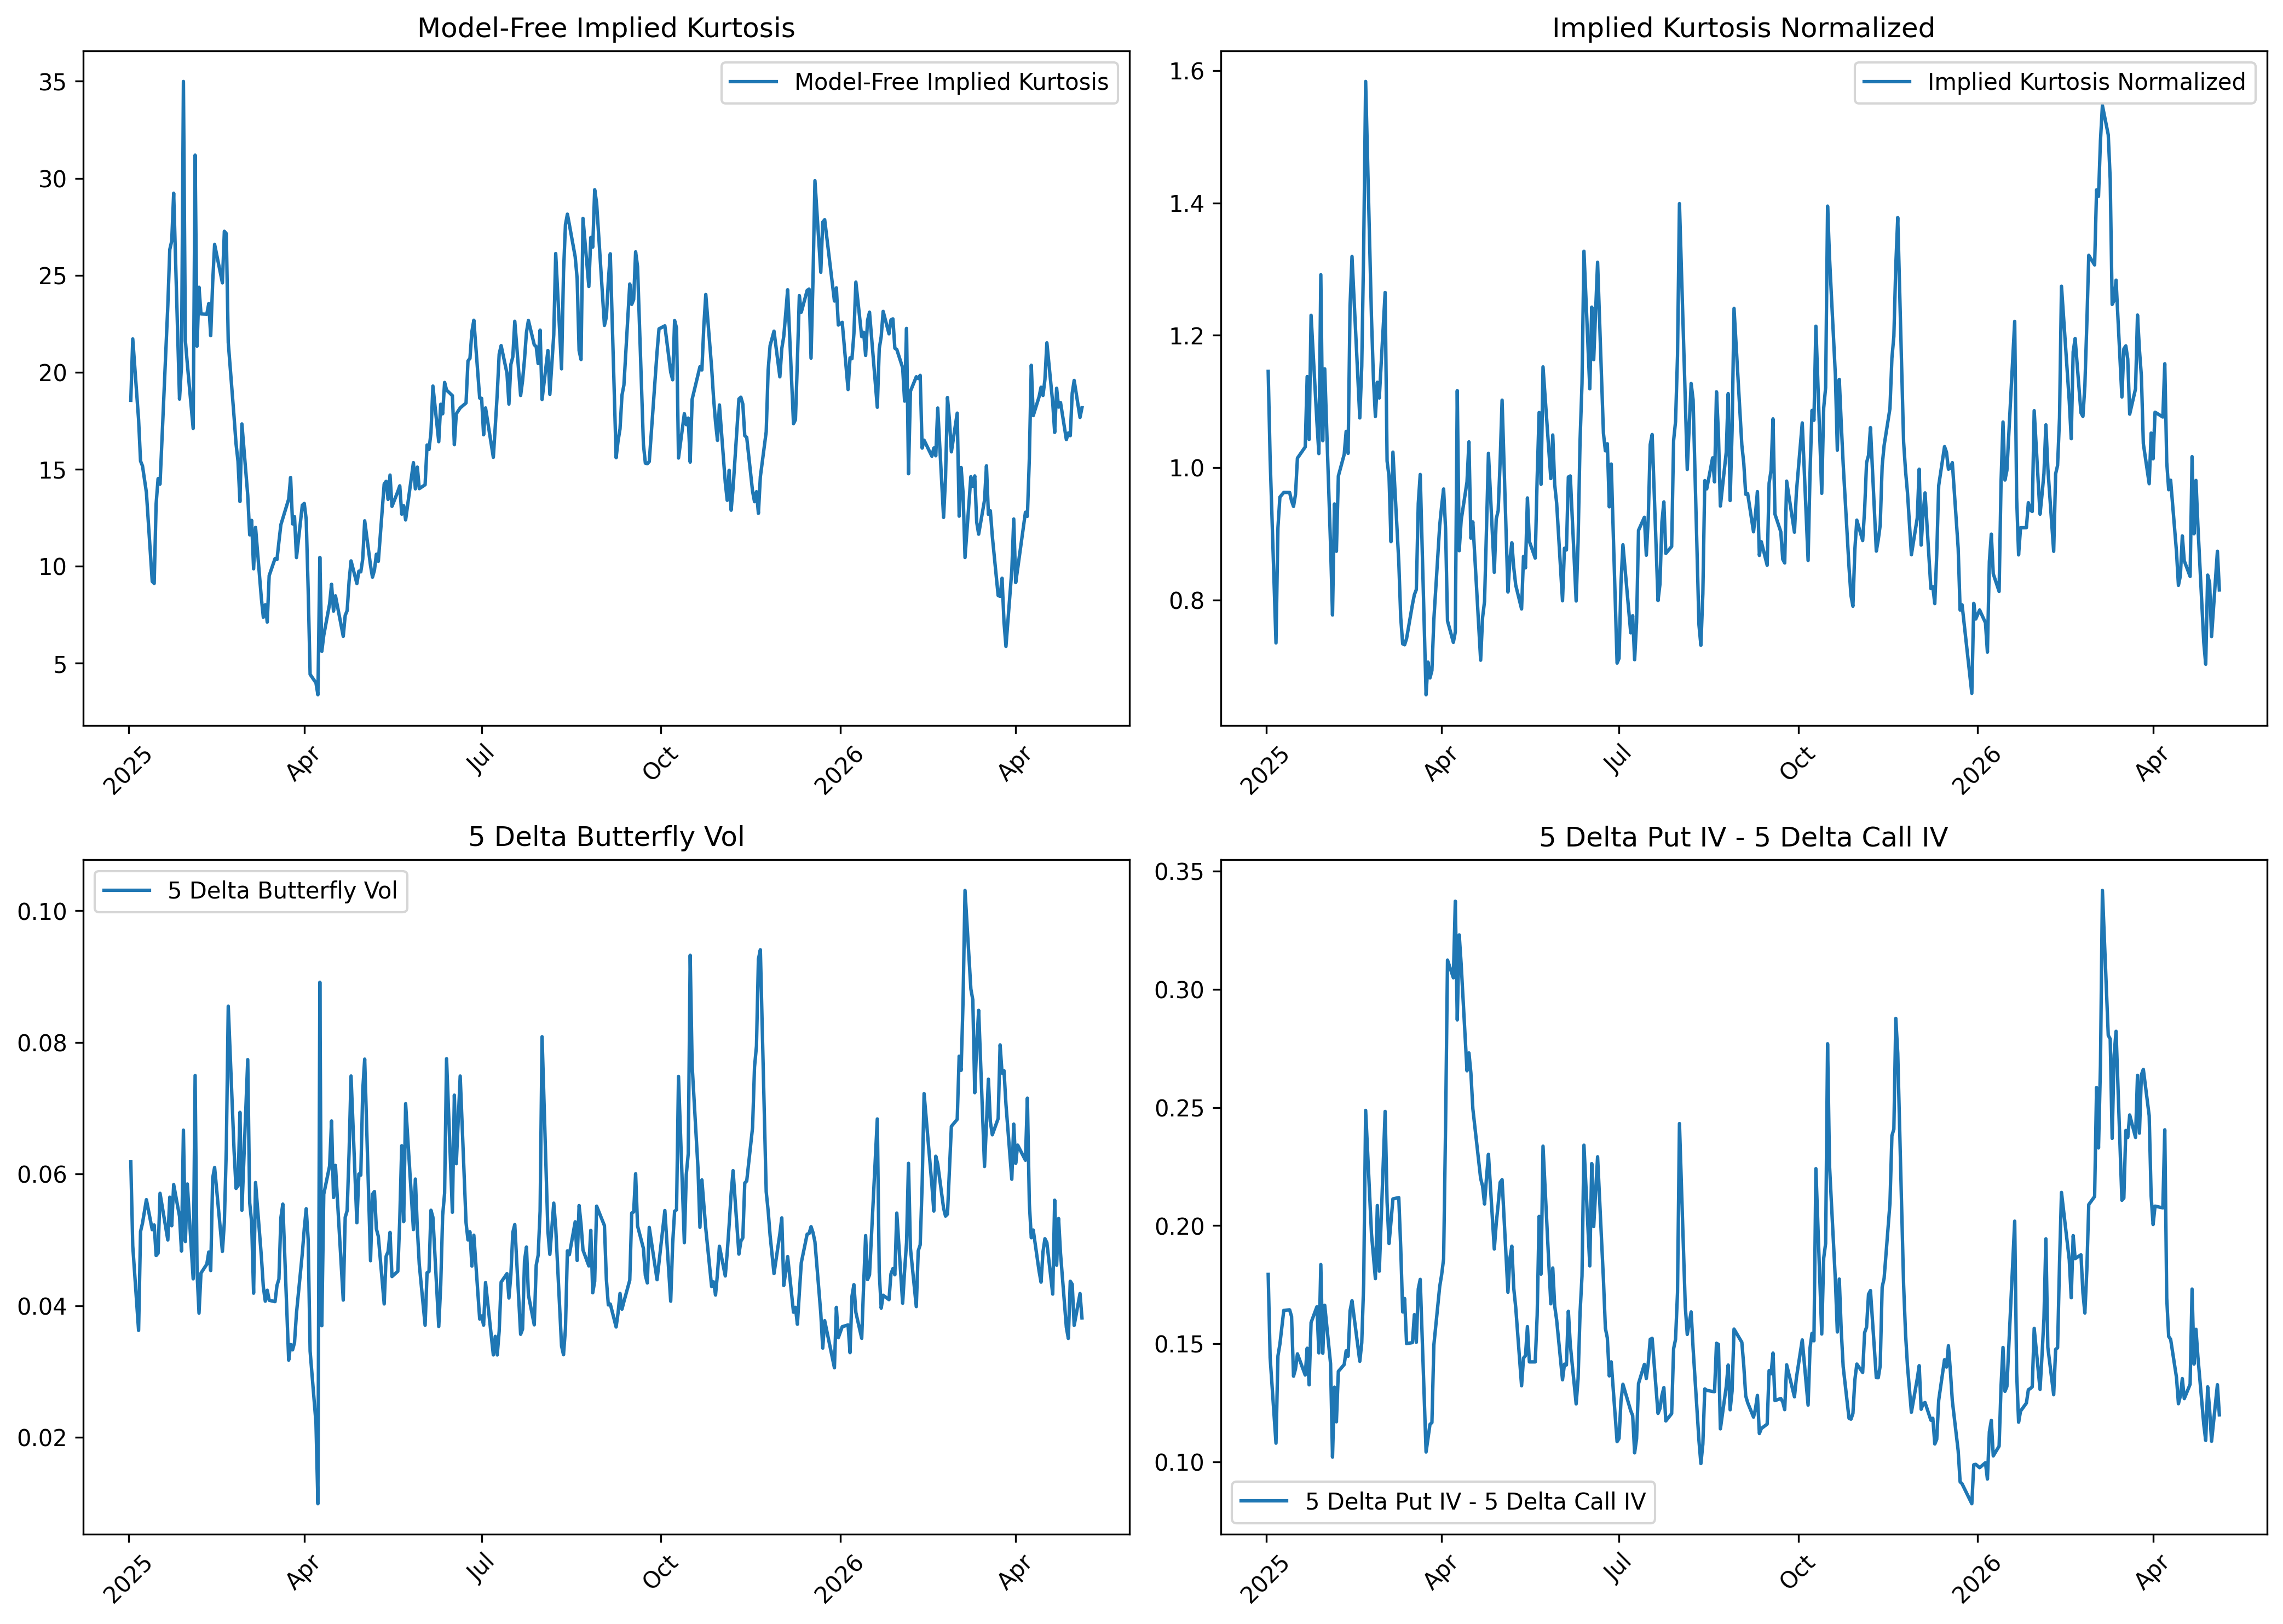
Implied Kurtosis:
- 5 delta put IV - 5 delta call IV
- (5 delta put IV - 5 delta call IV) / atm IV
- 0.5(call IV + put IV) - atm IV (Butterfly)
- Model Free Implied Kurtosis following Bakshi, Kapadia and Madan (2003)
These are all generated using specific options at a fixed maturity, this is similar to how you might estimate implied skew from a volatility curve and is related to the curvature of the curve. While it is not directly an implied vol-of-vol estimate it is related. The butterfly IV can be estimated using either 5 delta options or 25 delta. In Natenbergs Volatility Trading he swaps the call and put around but either metric is useful as long as you remember how you are calculating it. The model free implied kurtosis is a similar approach to estimating a risk-neutral moment from options prices as the model free implied skewness approach from Ito, we leave out the formula here but it can be found in their paper.
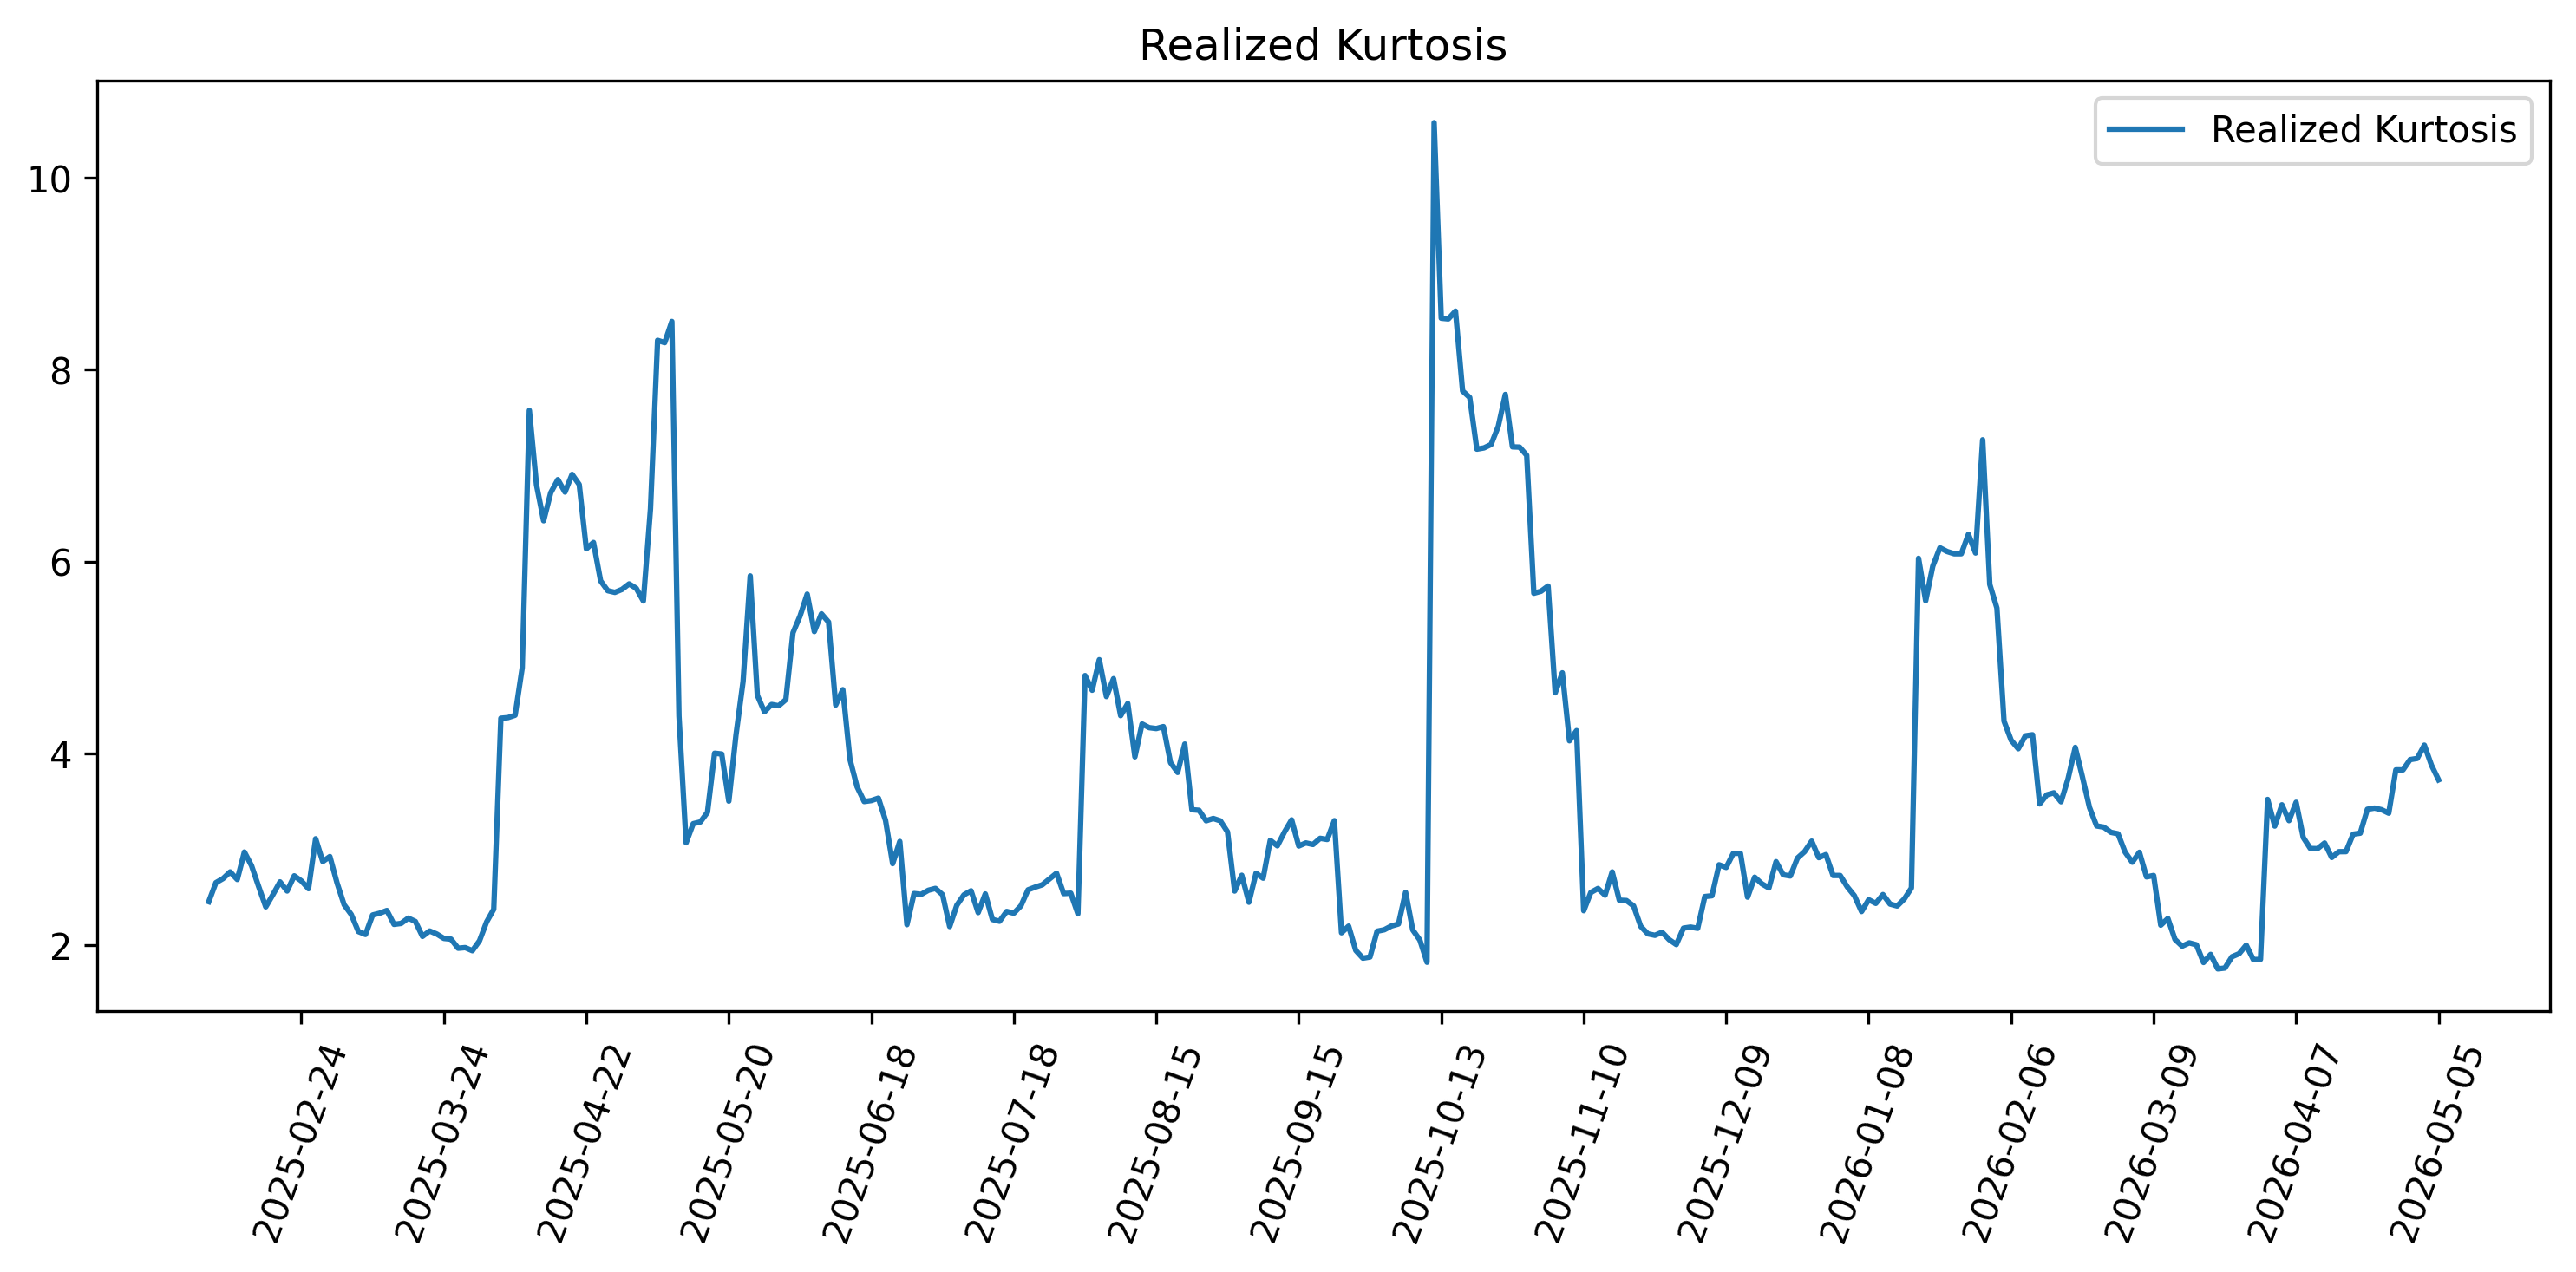
Realized Kurtosis:
- Rolling sample kurtosis from distribution of log returns
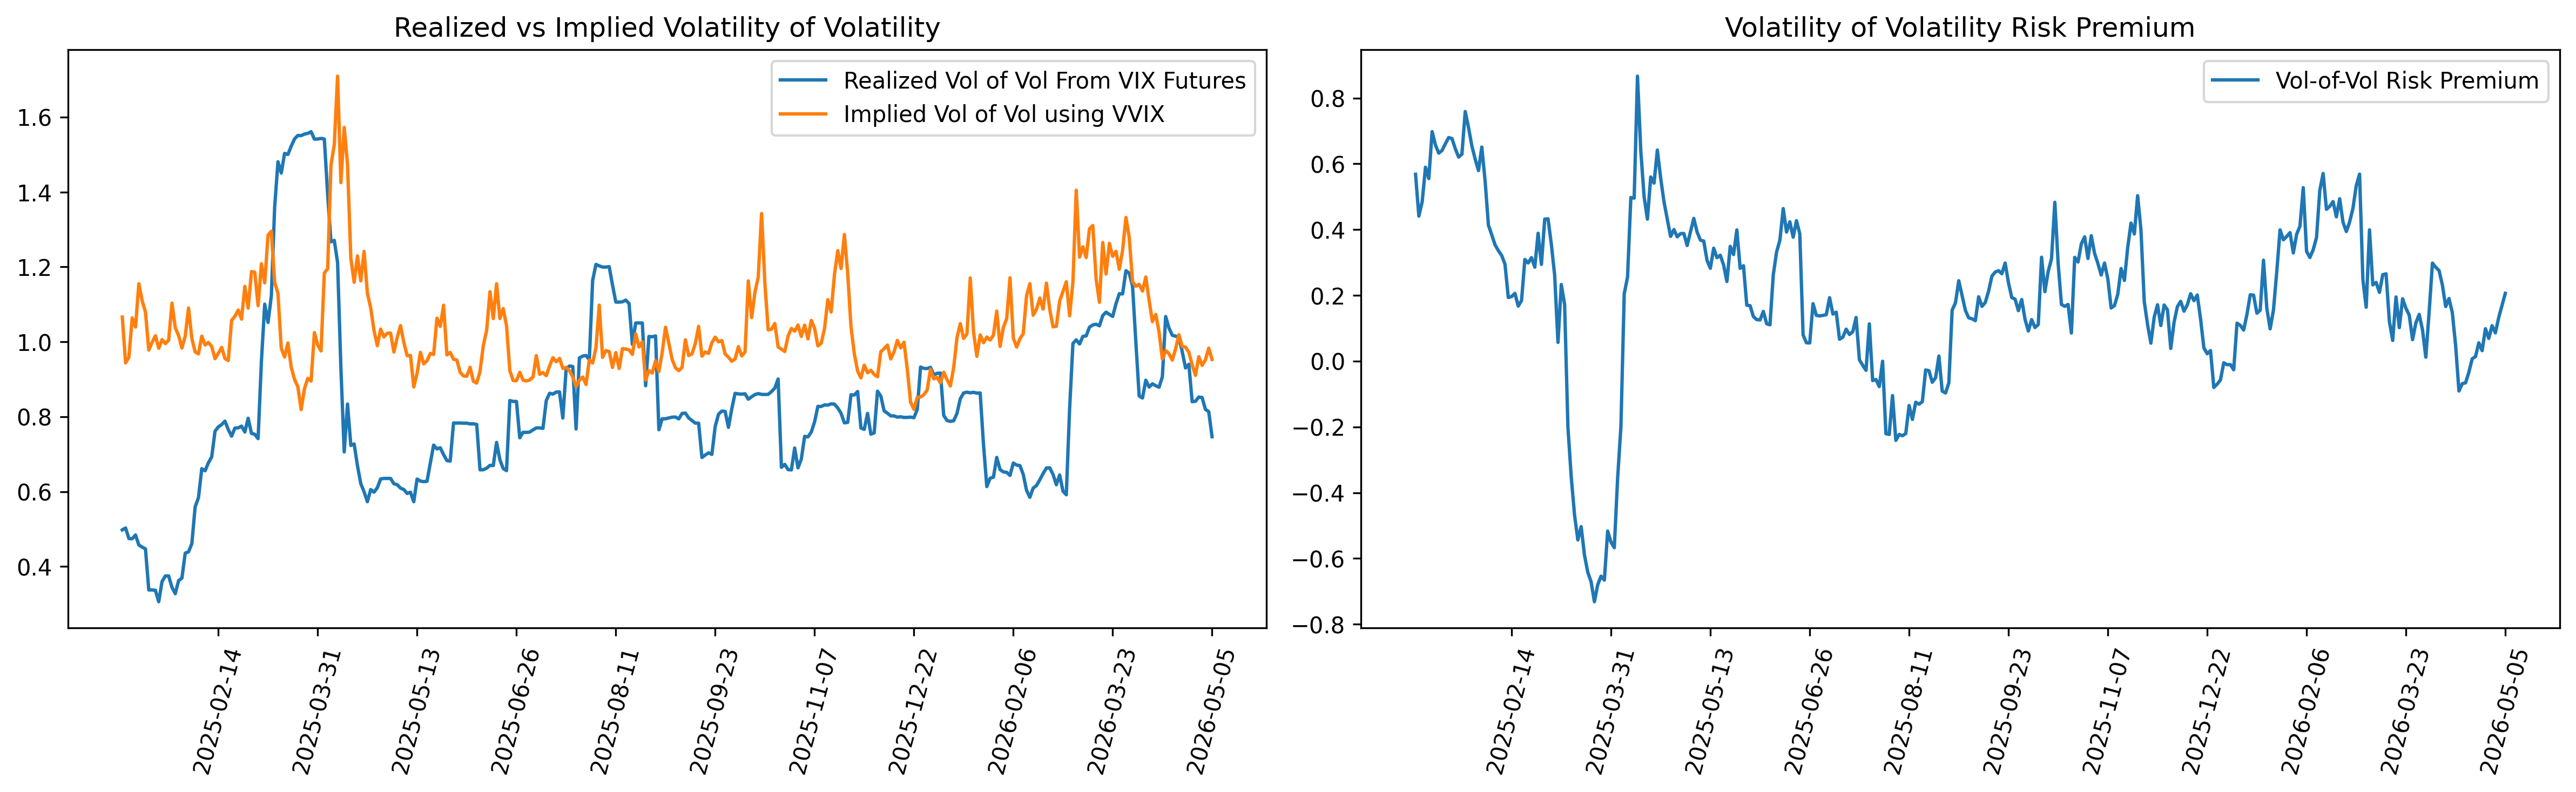
I want to add that there is a good paper by the Fed about estimating the vol-of-vol risk premium where they use the difference between the current level of the VVIX estimate minus the rolling 21 day front month maturity VIX future, Park, Y.-H. (2013). Volatility of Volatility and Tail Risk Premiums. We below I show this where the realized component is calculated as a rolling statistical estimate of volatility of a one month VIX Future.
Conclusion
Overall, the volatility surface contains a lot more information than just the market’s expectation of future volatility. By comparing option-implied estimates with realized or physical estimates, we can begin to isolate different types of risk premiums embedded in the surface. The variance risk premium captures the compensation investors demand for bearing volatility risk, the skew or skewness risk premium gives insight into how the market prices asymmetry and downside risk, and the volatility-of-volatility risk premium reflects the market’s pricing of uncertainty around volatility itself.
None of these estimates are perfect. Each depends heavily on the methodology used, the maturity chosen, the option data available, and the realized metric used for comparison. Still, I think these measures are useful because they give us a structured way to think about what the options market is pricing beyond simple directional views.
In future posts I will discuss risk premiums related dispersion/correlation and the rough volatility risk premium which relates to market implied roughness of the volatility path versus what is actually realized. Hopefully this post provided useful information for thinking about volatility-surface-related risk premiums and some of the ways they can be estimated. As always, all of the code and charts used in this post are available on my GitHub, and I am always open to feedback, corrections, or ideas for improving the analysis.
References
-
Hull, B., & Sinclair, E. (2021). The Risk-Reversal Premium. SSRN working paper.
-
Ito, A. (n.d.). Variance Risk Premium, Skewness Risk Premium and Equity Expected Returns. SSRN preprint.
-
Kozhan, R., Neuberger, A., & Schneider, P. (2012). The Skew Risk Premium in the Equity Index Market. SSRN working paper.
-
Lee, P. B. (2024). Optimal Skew Swap Replication. AlphaVols / SAAM.
-
Park, Y.-H. (2013). Volatility of Volatility and Tail Risk Premiums. Finance and Economics Discussion Series, Federal Reserve Board, 2013-54.
-
Yuan, J., Liu, D., Chen, C. R., & Ma, M. (2025). Estimating Volatility-of-Volatility: A Comparative Analysis. Economics Letters, 250, 112298.
-
Bakshi, G., Kapadia, N., & Madan, D. (2003). Stock Return Characteristics, Skew Laws, and the Differential Pricing of Individual Equity Options. The Review of Financial Studies, 16(1), 101–143.